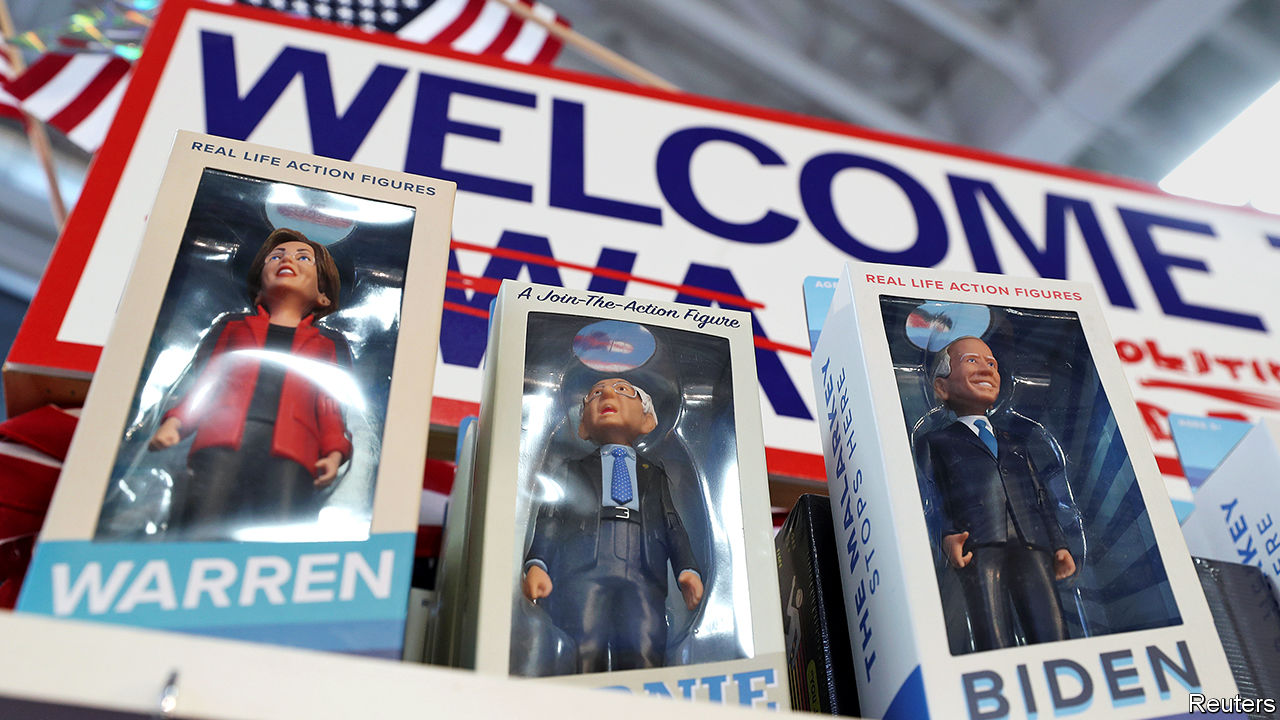
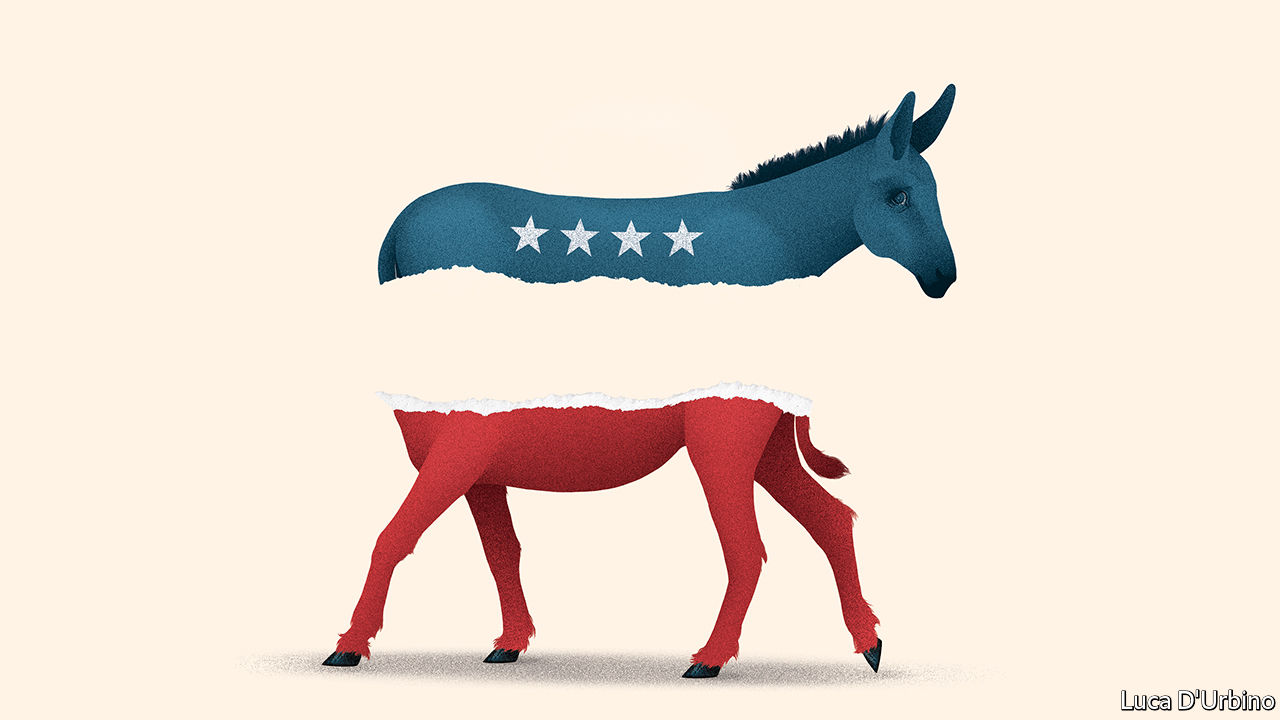
TWENTY-EIGHT candidates have thrown their hat into the ring for the Democrats’ presidential nominating contest in 2020. This field, the largest ever, includes United States senators and House representatives, mayors, entrepreneurs and even a self-help guru. Some candidates have already withdrawn. Those who remain are engaged in a battle for the future of the party. This portal will help you keep track of who is winning and who is losing and, perhaps more interestingly, why.
The main differences between the candidates concern government policy. Liberal candidates, such as Elizabeth Warren and Bernie Sanders, have embraced ambitious spending programmes to provide universal health care, increase access to higher education and deal with America’s worsening housing crisis. More moderate candidates, such as Joe Biden, have argued that some of these proposals are impractical. They have taken stances that appear more pragmatic given that only one-third of Americans call themselves liberals, according to polling provided to The Economist by YouGov, our pollster, and that Republicans will probably retain control of the Senate after 2020. But the primary is still anyone’s to win.
Related stories


Here you will find our estimate of each candidate’s performance in all high-quality, national public opinion polls conducted so far as well as the probability of victory inferred from political betting. You will also find data from YouGov, breaking down support for each candidate by demographic group. Under “Candidates” you will find further demographic data for each contender.
National polling model
Latest polls April 8th 2020, %
Above, we have calculated support for each candidate by aggregating publicly available, high-quality opinion polls. We include only surveys from pollsters who conduct their interviews over the phone with a live interviewer—rather than with automated machine recording—or that use rigorous and well-documented online methods.
| Date | Pollster | Joe Biden | Bernie Sanders | Margin of error | |
|---|---|---|---|---|---|
| Apr 05–07 | YouGov | 49% | 28% | – | ±4% |
| Mar 30–Apr 05 | Morning Consult | 61% | 36% | – | ±1% |
| Mar 29–31 | YouGov | 47% | 34% | – | ±4% |
| Mar 23–29 | Morning Consult | 61% | 36% | – | ±1% |
| Mar 22–25 | ABC News/Washington Post | 55% | 39% | – | ±5% |
| Mar 20–24 | Echelon Insights | 66% | 29% | – | ±5% |
| Mar 22–24 | YouGov | 47% | 34% | – | ±4% |
| Mar 18–24 | Ipsos | 43% | 28% | – | ±2% |
| Mar 16–22 | Morning Consult | 60% | 36% | – | ±1% |
| Mar 15–17 | YouGov | 48% | 32% | – | ±4% |
Breaking down support by demographic group gives an indication of why the contenders are doing well, or poorly, in the national numbers. We have crunched those numbers for the most important demographic categories: race, age, sex, education and ideology. Interested in the strength of Joe Biden’s support among African-Americans? Here’s where to look.
Candidate support by race
Since 1980 no Democratic candidate has won the nomination without winning a majority of African-American primary voters. But the candidate who wins in 2020 will also probably pull in large numbers of Hispanics.
Candidate support by age group
Millennials have recently surpassed the post-war Baby Boomers to become the largest single age group in America, but they do not cast ballots as frequently as older voters and are therefore underrepresented in the electorate. Their turnout in the primary in 2020 could determine whether more progressive candidates, who are popular with young Democrats (see Bernie Sanders’s numbers for details), will be victorious over a more moderate, centrist candidate who is popular with older voters.
Candidate support by education
Though the Democratic Party is often associated with educated elites, nearly two-thirds of all Democratic voters do not hold a college degree. By contrast, 37% of the party is made up of college-educated professionals, an influential but still substantial minority. The former group has historically tended towards more moderate candidates, but the latter still wields substantial power via political donations.
Jump to candidate
 Joe Biden
 Bernie Sanders
 Tulsi Gabbard
 Elizabeth Warren
 Michael Bloomberg
 Amy Klobuchar
 Pete Buttigieg
 Tom Steyer
 Deval Patrick
 Andrew Yang
 Michael Bennet
 John Delaney
 Cory Booker
 Marianne Williamson
 Julián Castro
 Kamala Harris
 Steve Bullock
 Joe Sestak
 Wayne Messam
 Beto O'Rourke
 Tim Ryan
 Bill de Blasio
 Kirsten Gillibrand
 Seth Moulton
 Jay Inslee
 John Hickenlooper
 Mike Gravel
 Eric Swalwell
Methodology
We estimate support for each candidate using a statistical method that combines Bayesian statistics with dynamic logistic regression and a Dirichlet distribution (forgive the jargon). The model aggregates polls over the course of the campaign, putting more weight on polls conducted recently, less on those with small sample sizes and accounting for “house effects”—the tendency for some polling firms to over- or underestimate support for certain candidates. We exclude polling firms that do not use rigorous methods. In the past, surveys conducted over the phone with a live interviewer or with online survey-takers that use well-thought-out methodologies have been more reliable than other methods.
We have produced demographic crosstabs using the past four weeks of polling data from YouGov, a polling firm. Analyses of voters’ preferences beyond their first-choice for the nomination come from the same micro-data, but our time-series graphs rely on data from the entire campaign.
Richard Ojeda, a West Virginia state senator, also ran for the presidency but he dropped out of consideration on January 25th 2019. He is not included in this interactive.
Sources: FiveThirtyEight; YouGov; PredictIt; The Economist