Fundamental Value slightly outperformed in Q3, returning 2.0% after fees vs 1.8% for the S&P 500. This brings the strategy’s annualized return to 17.9% vs 13.1% for the broader market.
FV’s outperformance has come in spite of two material drags. First, FV tilts toward value stocks, which have had weak relative returns. FV has outperformed the S&P 500 Value Index by 760 bps on an annualized basis. Second, FV has carried net cash, averaging a net long position of only 89% and a monthly beta of only 0.84. Despite a much more concentrated portfolio, FV has had 20% lower downside volatility than the S&P 500.


Market commentary
In our last quarterly letter, we discussed value investing in detail. We said it was the core of our philosophy at Bireme. We noted that value has been a source of long-term outperformance, though it has lagged substantially over the duration of the current decade-long bull market.
We studied the “value spread,” the difference between the valuations of the cheapest and most expensive stocks in the market. Higher levels indicate a bigger discount for value, and likely presage future outperformance. We found that the value spread is very elevated today -- the second highest reading since 1987, behind only the internet bubble. Following that peak in March 2001, value proceeded to outperform growth by 147% over the next five years.
But this begs the question: to what extent do value stocks deserve their larger-than-usual discount today? Is this merely a cyclical phenomenon, or is there some secular shift that has occurred to permanently favor the type of high-multiple stocks that populate growth investing portfolios? Should we stick to our course against temporarily unfavorable headwinds, or expect value’s underperformance to be a new, permanent feature of markets?
Macroeconomic variables
One possible source of secular change is found in macroeconomic variables. We addressed one of those concerns last quarter when we identified changes in the level and structure of interest rates (falling interest rates, as well as a falling term premium) as a driving force behind the relative appreciation of growth. More of the net present value of a growth stock is in anticipated cash flows far in the future, as compared to a value stock which has more near-term cash flow and existing assets. Thus, lower long-term rates enhance the relative attractiveness of growth.
While long-term rates can go lower, and the yield curve can be highly inverted for a time, both cannot go down indefinitely. Any normalization of rates will be positive for value, and even a stabilization in this downtrend will remove this headwind.
A side note: as discount rates have fallen along with interest rates, we should expect volatility to increase. For one, because a higher proportion of present value is due to anticipated long-term cash flows, changes in growth expectations will have a larger effect on stock prices. Changes in the discount rate itself can also drive volatility, and this effect is exacerbated at low starting rates. To illustrate, a 2% increase in discount rates from 8% to 10% will cause prices to drop by roughly 20% -- bad, but hardly cataclysmic. A 2% increase in discount rates from 2% to 4%, however, will cause prices to drop by roughly 50%. Therefore, today’s low level of interest rates and term premia means that, going forward, volatility will likely be higher, and growth is unlikely to continue to benefit from cyclically rising relative valuations.
Relative quality
In addition to macroeconomic variables, we might ask: is there anything about value stocks themselves that indicates they are worse than value stocks in the past? Are value stocks cheaper today because they are actually that much lower-quality than their growth peers?
There’s a narrative out in the market that would fit this hypothesis. This narrative holds that much of the value created today is being captured by a small segment of the market -- e.g., the “FANMAG” group: Facebook, Apple, Netflix, Microsoft, Amazon, and Alphabet (aka Google) -- and everyone else is getting left behind.
The data, however, does not show any evidence that value stocks are unusually low quality today. If anything, the evidence shows exactly the opposite: not only is value unusually cheap, value is also unusually high quality.
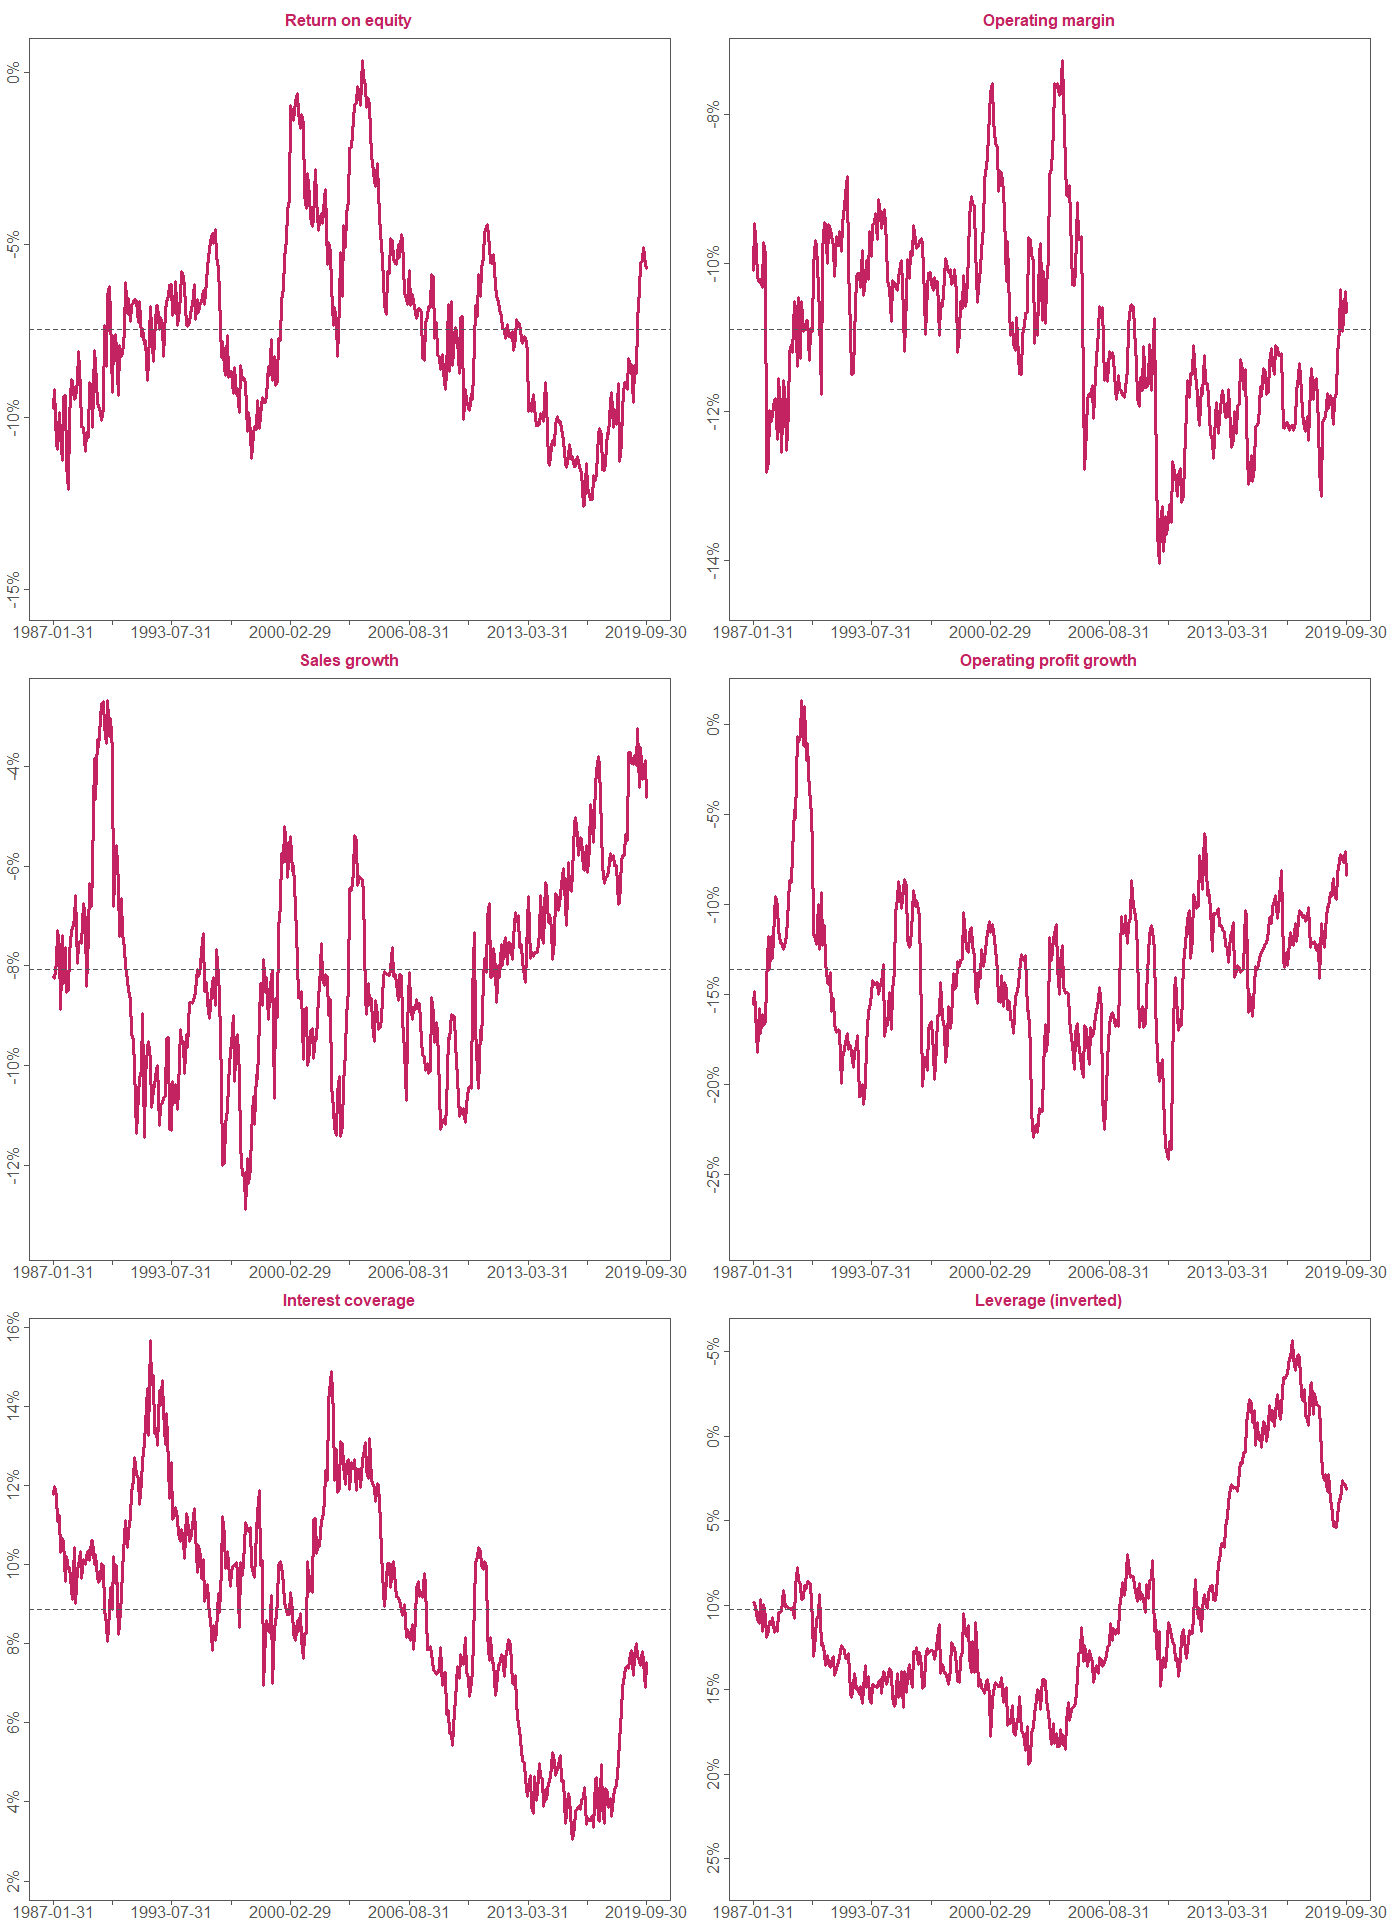
The chart below shows the difference between the median value stock and the median growth stock since 1987 across six different quality metrics.1 Higher numbers in the chart are positive for value stocks. Horizontal lines indicate the historical average difference in quality. Five of the six metrics show above-average quality for value, which gives us confidence that value does not deserve its large discount.
Conclusion
Ultimately, we ascribe value’s historical outperformance to investor bias. Value stocks are inherently unattractive. These businesses often have problems (lawsuits, regulatory risks, or declining margins), or they are maybe just boring (they don’t have visionary founders, and aren’t transforming an industry). They have fundamentally harder stories to explain to your clients -- and engender especially difficult conversations if their price goes south. Therefore many investors eschew holding them in their portfolio.
Nevertheless, many value stocks are solid businesses and trade at large discounts to fair value. Those willing to own these businesses when others will not can make excess returns. We do not think investor bias against aesthetically unappealing stocks has suddenly disappeared from the market -- in fact, Fundamental Value has capitalized handsomely on such situations despite value’s poor run. (Read more about our cognitive bias framework here.)
Investors cost themselves dearly when they abandon a well-reasoned investment strategy to chase hot funds and asset classes. Though value’s underperformance over the past decade has been trying, we think better times are ahead: not only is value especially cheap today, it is also unusually high quality. We believe value investors will be rewarded, sooner rather than later, for sticking with their discipline.
Portfolio commentary
The biggest loser in the quarter was HCA Healthcare, which declined from $134 to $120. At $120 HCA traded for 12x PE, 13.5x FCF, and 8.5x EBITDA. We feel this substantially undervalues HCA, whose hospital and outpatient networks enjoy substantial competitive advantages. These advantages have allowed HCA to grow revenues by 85% and double operating income since 2012, all while buying back 18% of their shares. The stock continues to trade at a discount to the broader market despite this track record.
HCA is the largest for-profit hospital business in the United States. They have 184 hospitals, 48,500 beds, and 38,000 medical staff, mostly located in desirable urban areas with higher than average population growth. Within these cities HCA employs a local density strategy — with an average market share of 25% — that ensures its facilities are must-have for health insurance plans. This provides substantial leverage for HCA when negotiating reimbursement rates.
This strategy would be almost impossible for HCA’s smaller, less-profitable competitors to replicate. Consider HCA’s top publicly traded competitor, Tenet Healthcare (THC), the fifth largest hospital system in the US. THC generated about $400m of FCF and $200m of net income last year. To attain HCA’s scale in one of HCA’s core markets, THC would need to invest a decade’s worth of their free cash flow. This is implausible, a fact the THC CEO essentially admitted when they sold their Houston-area hospitals to HCA (as we noted in our Q4 2017 letter).
Some competitors, like Community Health Systems (CYH), have focused on rural markets, where one or two facilities might be considered a “density strategy.” But these markets have been subject to weak demographic trends for years, creating negative admissions growth and lower bed utilization. CYH has struggled so mightily that its debt load has ballooned to nearly 9x EBITDA, and there’s a good chance it will go bankrupt.
As a result of their strategy, HCA’s hospitals have consistently seen growth in admissions and pricing. But despite growth, margins, and ROIC that are best in class, the market has historically priced HCA in line with peers at 8-9x EBITDA and 11-13x PE, which remains true to this day. We think this is a case of representativeness bias, whereby investors have mentally grouped HCA with a struggling industry despite evidence that HCA has a better model.
The biggest winner in the quarter was Cogeco Inc., a Canada-based cable internet provider that we first mentioned in our Q2 2017 letter. The stock appreciated about 15% in Q3 2019, mostly due to better-than-expected results for the Canadian broadband business.
At Cogeco’s current valuations of roughly 8x EBITDA, 14x PE, and 12x FCF, the stock trades broadly in line with mediocre Canadian telcos such as BCE and Shaw Communications despite better fundamentals. We believe this is yet another case of representativeness bias. Canadian investors do not seem to have fully realized the tremendous value of an internet-connectivity focused cable company without major local competition and without material exposure to the more-competitive mobile wireless industry. Investors in the US, by contrast, have pushed up the valuations of such stocks to as high as 17x EBITDA (for Cable One).
One easy way to see the difference in quality between Cogeco’s business and the companies I mentioned above is to look at EBITDA per share growth over time. Over the past decade, Cogeco’s EBITDA per share has increased by 109%. BCE and Shaw have grown theirs just 29% and 18%, respectively, over the same period. Even better-managed competitors like Rogers Communications have only grown this metric by 65%.
Cogeco remains one of our largest positions.
We initiated a material short position in the quarter, one of our first at Bireme. We have largely eschewed single-name shorts in the Fundamental Value strategy, preferring to focus on long ideas and an occasional hedging position. This focus has paid off, as FV has significantly outperformed the S&P 500 since inception. However, given the rise in the US market over the past few years, we are currently putting additional energy into finding single-name shorts that can lower the market risk of the portfolio. As always, we will seek out positions that align with our cognitive-biases framework of security mispricing.
Our new short is a bottling company based in Charlotte, NC named Coca-Cola Consolidated (COKE). COKE bottles for the “real” Coca-Cola — a separate company with ticker KO. COKE suffers from a lack of organic growth and terrible corporate governance, yet has a stretched valuation amid evidence of cognitive bias amongst investors.
COKE’s historical numbers -- they’ve doubled revenue since 2015 -- are somewhat misleading. Their growth has been almost entirely inorganic: growth has come via acquisitions from KO’s bottler divestiture program. But KO has no more bottlers to sell. It is therefore extremely unlikely that this inorganic growth will be repeated. If COKE does grow, it is likely to do so at a low 2-3% organic rate, and at a low return on capital: historical ROIC is <10% and EBIT margins are around 5%.
And yet, incomprehensibly, the stock trades at 47x trailing EPS. Why? One theory is that retail investors are confusing the company with the “real” Coca-Cola (i.e. KO, the $200b market cap company). And in fact, COKE appears to be intentionally encouraging this confusion. In January 2019, the company removed “Bottling Co.” from its name, resulting in the current, vague name “Coca-Cola Consolidated.” We can’t think of a legitimate reason why you would remove the sole differentiating component from your company’s name… unless confusion is your goal.
This is the type of investor mistake we seek to exploit in Fundamental Value. It is a perfect example of availability bias, whereby investors over-index on salient but superficial information that, upon further analysis, turns out to have little relevance. In this extreme case, investors may simply be investing in the wrong company.
While it seems absurd to postulate such carelessness on the part of investors, it is a scenario that is not without precedent. In another extreme example, confused investors drove up the price of a delisted penny stock 500x earlier this year simply because it had a similar name and ticker to IPO darling Zoom Video Communications. Matt Levine at Bloomberg’s Money Stuff has been making us laugh (and cringe) by reporting on similar oddities for years (e.g. see here, here, here and here). We suspect similar behavior caused the price of COKE shares to nearly double over the last year.
Regardless of who the marginal buyers are, their well-being is far down the list of management’s priorities. At the top is the company’s evangelical religious endeavours. The company is upfront about this: their code of conduct lists “to honor God in all we do” as “our most significant purpose,” and this is echoed in the annual report. The CEO, Frank Harrison, goes even further at times, saying that he believes “God owns the company,” rather than shareholders.
It is convenient, of course, that God does not sit on the board and cannot challenge Mr. Harrison’s managerial decisions. But crucially, neither can public shareholders. This is due to the Harrison family’s super-voting B shares, which confer 20x voting rights. His firm control of the company allows Mr. Harrison to enjoy the sort of perks and self-dealing that got Adam Neumann fired at WeWork:
- He receives $8.6m per year in lease payments related to property COKE rents from him.
- He was paid $11m in total compensation last year, which included personal use of the company plane worth over $200,000.
- He donated $5m of shareholder money in 2018 to charities including one that he runs with his wife.
Even if we exclude the charitable contributions, Harrison collects nearly $20m from COKE per year. This figure is spitting distance from the $28m pay
package of another Charlotte-based CEO, Bank of America’s Brian Moynihan, despite the fact that BAC’s profits were 500x that of COKE’s in 2018. We think COKE shareholders are getting a terrible deal with this arrangement, but have little recourse. We remain short as of this writing.
We are grateful for your business and your trust, and a special thank you to those who have referred friends and family. There is no greater compliment.
- Bireme Capital
Follow our content by subscribing here.
1 Data from Bloomberg, Compustat and FRED. To create our growth and value buckets, we first screen out securities for which a simple summary statistic is unlikely to accurately reflect the market’s true valuation of a tradable security. For example, maybe a company’s fundamentals are wildly variable from year to year, or its accounting has some strange quirks, or the company is too small to really be investable, etc. We also exclude financials as they are substantially different than the rest of the market. Then we calculate fundamentals and market cap, making adjustments where appropriate (returnable cash, minority ownership, dilution, recent M&A, etc).
This results in three summary statistics (price to sales, price to gross profits, and price to book value) for a universe of roughly 1,000 investable US stocks every month-end since 1987. The most expensive third of this universe becomes our growth basket, and the cheapest third becomes our value basket. For simplicity, when one of the quality metrics above requires a measure of profitability, we use operating profits in this analysis.
We don’t actually use these metrics in our investing; we do much more in-depth work on each security than merely the screening, adjusting and sorting seen here. But this metric is a useful tool to get a sense of the current opportunity set available in the market, and as an initial screen for high-quality ideas.