

Abstract
California has experienced devastating autumn wildfires in recent years. These autumn wildfires have coincided with extreme fire weather conditions during periods of strong offshore winds coincident with unusually dry vegetation enabled by anomalously warm conditions and late onset of autumn precipitation. In this study, we quantify observed changes in the occurrence and magnitude of meteorological factors that enable extreme autumn wildfires in California, and use climate model simulations to ascertain whether these changes are attributable to human-caused climate change. We show that state-wide increases in autumn temperature (∼1 °C) and decreases in autumn precipitation (∼30%) over the past four decades have contributed to increases in aggregate fire weather indices (+20%). As a result, the observed frequency of autumn days with extreme (95th percentile) fire weather—which we show are preferentially associated with extreme autumn wildfires—has more than doubled in California since the early 1980s. We further find an increase in the climate model-estimated probability of these extreme autumn conditions since ∼1950, including a long-term trend toward increased same-season co-occurrence of extreme fire weather conditions in northern and southern California. Our climate model analyses suggest that continued climate change will further amplify the number of days with extreme fire weather by the end of this century, though a pathway consistent with the UN Paris commitments would substantially curb that increase. Given the acute societal impacts of extreme autumn wildfires in recent years, our findings have critical relevance for ongoing efforts to manage wildfire risks in California and other regions.
Export citation and abstract BibTeX RIS
1. Introduction
California has recently endured a multi-year period of unprecedented wildfire activity. The state's single deadliest wildfire, two largest contemporary wildfires, and two most destructive wildfires all occurred during 2017 and 2018 [1]. Over 150 fatalities were directly attributed to these fires [2]—a total greater than during any California earthquake since San Francisco's 'Great Quake' of 1906 [3]. Over 30 000 structures and >1.2 million ha burned in 2017–2018, including nearly the entire Sierra Nevada foothill town of Paradise (population 27 000). State-level fire suppression expenditures exceeded $1.6 billion in 2017–2018 [1], and estimated economic losses exceeded $40 billion [2]. Wildfire smoke was transported across the state, exposing millions to prolonged periods of degraded air quality, leading to public health emergencies and the extended closure of thousands of schools and businesses [4]. In the wake of these events, California's largest electricity utility has implemented a policy of pre-emptive 'Public Safety Power Shut-Offs' during periods of severe wildfire risk to reduce the probability of ignitions—resulting in widespread and disruptive California power outages in autumn 2019 [5, 6].
The recent California wildfires have garnered widespread attention, with an especially high level of interest from policymakers and emergency responders seeking to understand the multiple contributors to the increase in wildfire disasters. Quantitative assessments of changing wildfire risk factors have thus become critical as California moves beyond the initial stages of short-term disaster recovery and begins to develop risk mitigation, land management, and resource allocation strategies.
Changing demographic factors have undoubtedly played a substantial role in community exposure and vulnerability [7]—including the expansion of urban and suburban developments into the 'wildland-urban interface' [8]. In many forested regions that historically experienced frequent, low-intensity fire, a century-long legacy of fire suppression has promoted the accumulation of fuels, likely contributing to the size and intensity of some fires [9, 10]. Nevertheless, the broad geographic extent of increased burned area in California and the western United States (U.S.)—across geographies and biomes [11, 12], and even when limited to lightning-caused fires [13, 14]—suggests that demographic and forest management factors alone are insufficient to explain the magnitude of the observed increase in wildfire extent over the past half-century.
California's climate has changed considerably over the past several decades [15]. The state's five warmest years on record occurred in 2014–2018 (figure S1 (stacks.iop.org/ERL/15/094016/mmedia)). In addition, over the past century, robust state-wide warming occurred during all 12 months, with the most pronounced warming in the late summer and early autumn (figure S1). This warming has increased the likelihood and magnitude of hydrological drought [16–18], decreased mountain snowpack [19], and increased vegetation moisture stress and forest mortality [20]. Rising temperatures and declining snowpack—in combination with precipitation deficits that are consistent with emerging evidence of mechanisms that support decreasing precipitation in autumn and spring [21–23]—have acted to extend California's fire season [13, 24, 25]. As global warming continues in the future, regional warming and snowpack loss are expected to accelerate [26–28], concurrent with a regional increase in the frequency of both wet and dry precipitation extremes [17, 21, 29–32]. Therefore, even absent substantial changes in average precipitation, warming and seasonal shifts in hydroclimate will likely yield pronounced aridification across most of California [16].
Over the past decade, numerous studies have provided substantial insight into the influence of historical climate change on wildfire risk (e.g. [12, 33, 34]). Studies have identified spring and summer warming and earlier melting of snowpack [13, 24]—accompanied by declines in precipitation and wetting rain days during the fire season [35]—as important influences on large wildfires in the western U.S., and demonstrated a 'detectable influence' of historical anthropogenic climate forcing on long-term increases in area burned in Canada [36]. Additional recent studies have attributed approximately half of the increase in annual forest fire area in the western U.S. since the early 1980s to warming-induced increases in fuel aridity [37, 38], and found that anthropogenic climate forcing has greatly enhanced the probability of recent extreme fire seasons (e.g. [39–41]).
Recent autumns have been characterized by multiple large and fast-spreading wildfires burning simultaneously across California. This simultaneous occurrence can quickly compromise the efficacy of local, regional, and even national suppression efforts. Indeed, autumn fires in particular may expose an additional vulnerability: many of the temporary firefighting resources deployed during the core summer fire season—including personnel, vehicles, and aircraft—become unavailable as winter approaches. This is because funding for fire suppression activities has historically been aligned with the 20th century seasonality of wildfire, which typically decreases across most of the American West in the autumn (e.g. [42]). As the seasonality of the fire season broadens in a warming climate, a mismatch can emerge between firefighting resource availability and actual needs [43].
The consequences of such a confluence of events were starkly evidenced in 2018, when large late-autumn fires burning simultaneously in northern and southern California created major logistical challenges, and the heavy commitment of resources simultaneously in both regions required national resources to be ordered [44]. The scope of the resulting wildfire disasters motivates formal analysis of possible changes in the likelihood of warm, dry autumns that enable widespread late season fire activity simultaneously in both northern and southern California.
We therefore focus primarily on climatic factors that contribute to extreme wildfire conditions during autumn, including during two particularly devastating November 2018 events: the Camp Fire, which occurred in a transitional oak woodland in the northern Sierra Nevada foothills; and the Woolsey Fire, which occurred in the coastal chaparral shrub regime near Los Angeles. Both fires ignited during strong and dry 'offshore' downslope wind events, known locally as the Santa Ana winds in Southern California and Diablo winds in parts of Northern California. The frequency and strength of Santa Ana winds peaks in winter [45], but such winds in autumn that co-occur with dry fuels are responsible for a disproportionate fraction of both area burned [46] and wildfire losses in much of California [47, 48]. While offshore winds in November are not unusual, much of interior northern California and coastal southern California experienced the hottest summer on record in 2018, and autumn rainfall did not arrive across much of the state until mid-to-late November—thus predisposing the region to extreme fire danger conditions.
Motivated by the conditions that led to extreme autumn wildfire activity in 2018, we investigate changes in autumn temperature, precipitation, and daily fire weather indices, with a particular emphasis on the simultaneous co-occurrence of extreme conditions in northern and southern portions of the state. Analyzing both observational and climate model evidence, we seek to quantify (i) whether the occurrence of climate conditions contributing to extreme autumn wildfire potential has changed in recent decades; (ii) whether anthropogenic climate forcing has contributed to any detected changes in extreme fire weather; and (iii) how continued global warming could alter the probability of extreme fire weather in the future. We emphasize that the present investigation only considers changes in climatic contributions to wildfire risk, irrespective of changes in fire ignitions, vegetation, land use or management strategies.
2. Materials and methods
2.1. Historical observations of climate, fire weather, and area burned
We analyze gridded meteorological data (1/24° spatial resolution) from the gridMET database [49] during 1979–2018. We calculate seasonal-mean temperature, precipitation, and Fire Weather Index ('FWI') for each autumn season (September through November; 'SON') from 1979 to 2018 (shown in figures 1 and 2).

Figure 1. Observed state-wide trends in autumn climate and area burned over California. Time series show each year's value for SON (A) temperature, (B) precipitation, (C) FWI, and (D) log10(burned area). Fitted trends and p-values are calculated using the block bootstrapping approach of Singh et al [50], which accounts for time dependency (see Methods).
Download figure:
Standard image High-resolution image
Figure 2. Observed climate trends across California. Maps show 1979–2018 trends in observed autumn-mean (A) surface air temperature (˚C per decade), (B) precipitation (% change over period), and (C) FWI (units per decade). For precipitation, trends are displayed for each grid point as change relative to the 1979 value. Black boxes on each map indicate the boundaries of the Northern Sierra ('Paradise') and South Coast ('Malibu') regions discussed in the text. (D) Time series plots show observed autumn mean temperature, precipitation, and FWI for the Northern Sierra ('Paradise'; left) and South Coast ('Malibu'; right) regions for 1979–2018. Fitted trends and p-values are calculated using the block bootstrapping approach of Singh et al [50], which accounts for time dependency (see Methods).
Download figure:
Standard image High-resolution image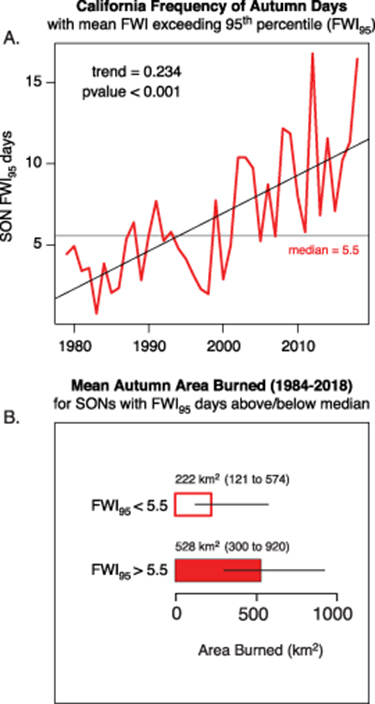
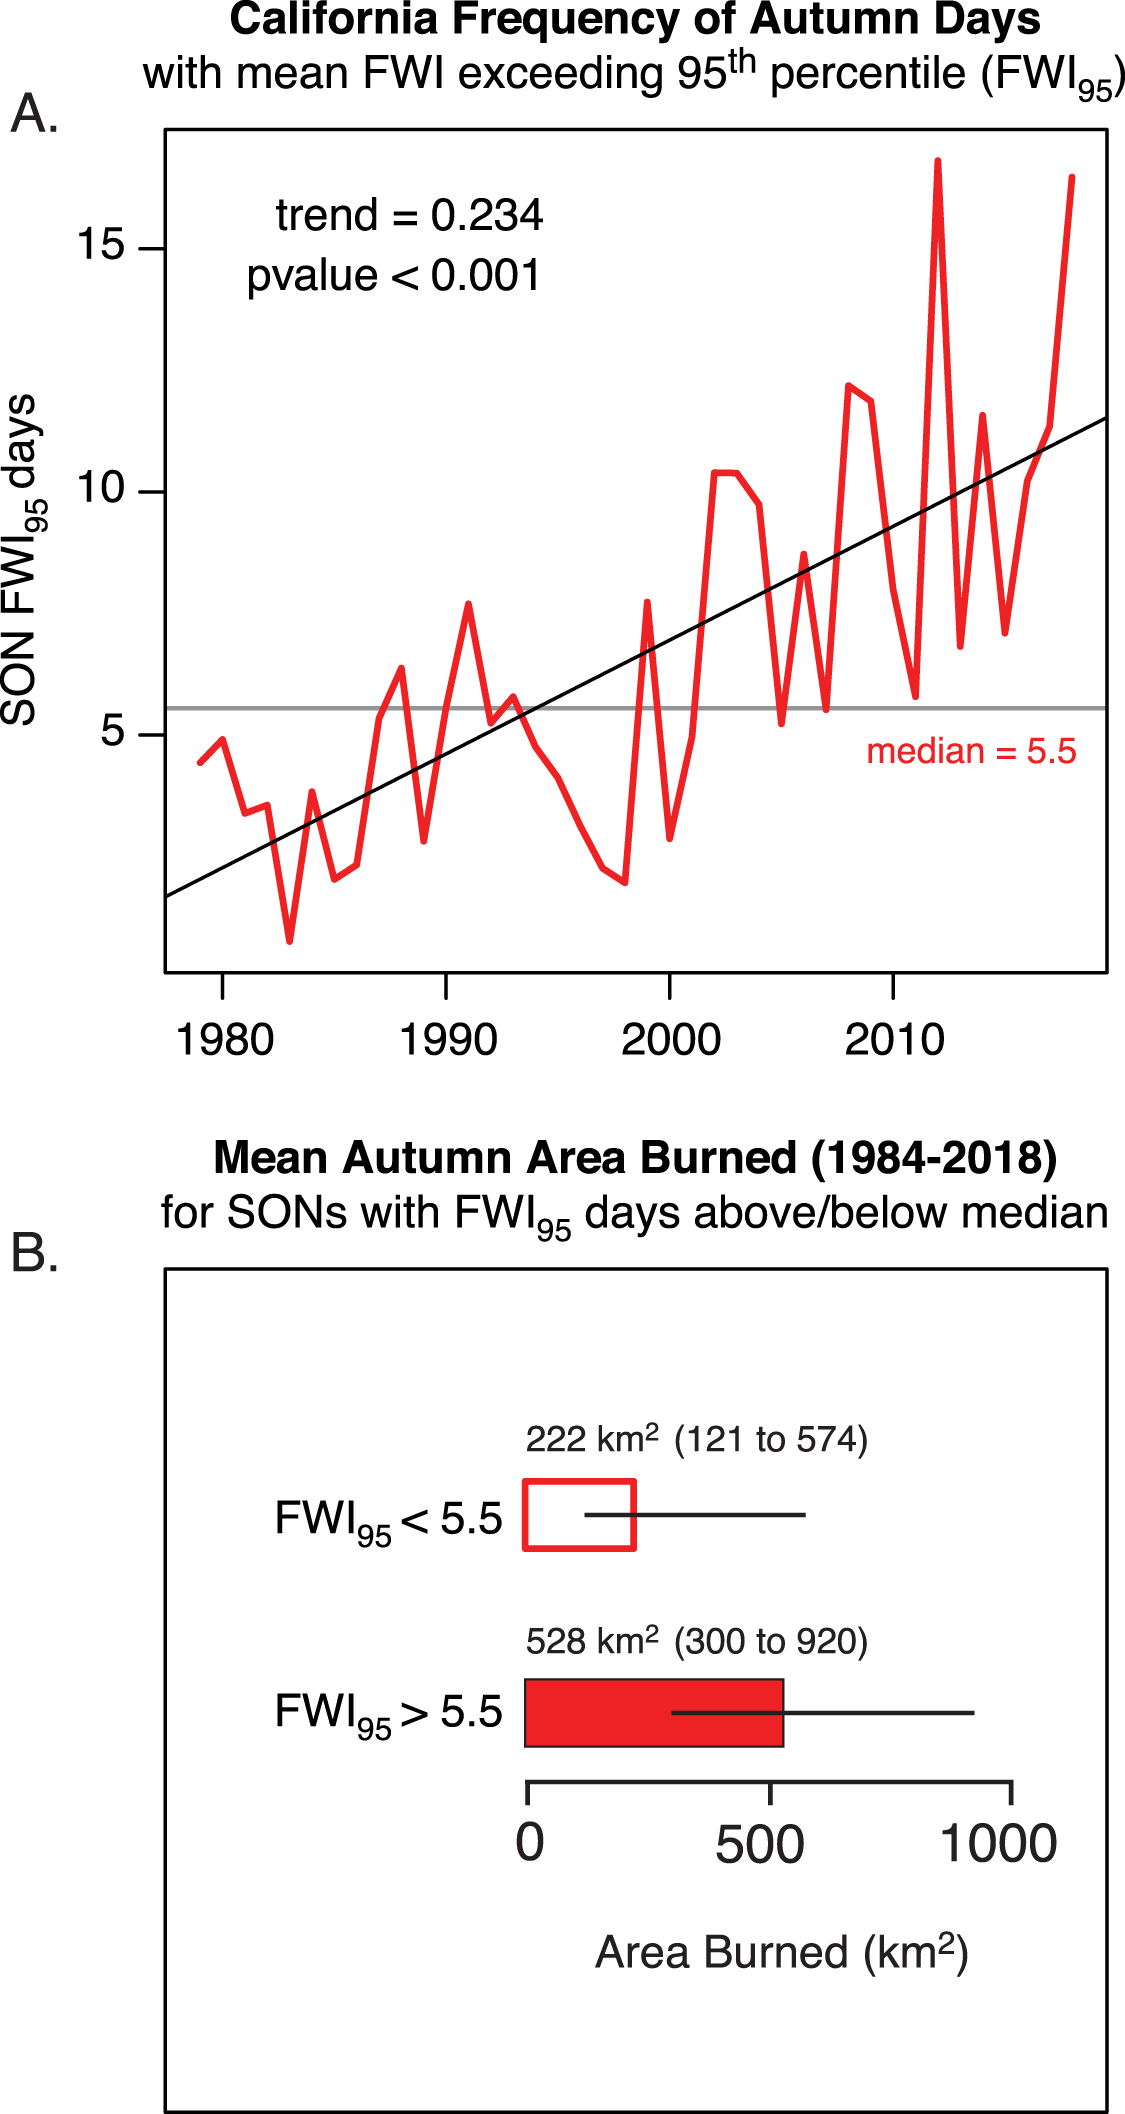
Figure 3. Observed relationship between extreme autumn fire weather days and autumn burned area. (A) The mean number of days in each autumn from 1979–2018 in which the daily FWI exceeded the locally-defined 95th percentile (FWI95). Fitted trend and p-value are calculated using the block bootstrapping approach of Singh et al [50], which accounts for time dependency (see Methods). (B) The mean SON burned area for years in which the mean autumn FWI95 frequency was above/below the median value (approximately 5.5 d). Uncertainty of the estimates is quantified using bootstrap resampling with replacement (see Methods).
Download figure:
Standard image High-resolution imageThe FWI (from the Canadian Forest Fire Danger Weather Index System) is a widely-used generalized measure of fire potential that incorporates both fuel aridity and fire weather (using maximum temperature, minimum relative humidity, wind speed, and precipitation), irrespective of fuel type and abundance [51]. FWI closely tracks interannual variability of other commonly used fire danger metrics such as Energy Release Component (ERC) [37], and exhibits strong empirical links to individual high-intensity fire events (e.g. [48]) and interannual variability in burned area for much of the globe (e.g. [52]).
At each grid point in California, we calculate (i) seasonal-mean temperature by averaging the daily maximum and minimum temperatures in SON of each year; (ii) seasonal total precipitation by summing the daily precipitation accumulation in SON of each year; and (iii) seasonal-mean FWI by averaging the daily FWI values in SON of each year (shown in the maps in figure 2). In addition, we calculate spatially averaged values of SON temperature, precipitation and FWI over the land grid points of three domains: (i) state-wide, encompassing land grid points in California (shown in figure 1); (ii) a Northern Sierra region (38.75–40.75 °N, 122.875–120.375 °W) encompassing the city of Paradise and the Camp Fire footprint (shown in figure 2); and (iii) a South Coast region (33–35 °N,120–117.5 °W) encompassing the city of Malibu and the Woolsey Fire footprint (shown in figure 2).
In addition to these climate observations, we analyze burned area data from the Monitoring Trends in Burn Severity dataset during 1984–2016 [53] that includes all large fires >404 ha; these data have been extended through 2018 using burned area from MODIS [54] and applying bias adjustments to the MODIS records [37]. Data include burned area by wildfires that had fire discovery dates between September 1 and November 30, and do not include wildfire events that began prior to September. It is possible to separate burned area by vegetation class (e.g. [12]), and because we find that only 43% of SON burned area over the period of record occurred in forests, we use total burned area for the state-wide analysis shown in figure 1.
For each of the regional-mean climate and area burned time series, we quantify the linear trend and statistical significance using the nonparametric bootstrap resampling approach described in Singh et al [50], using n = 10 000 iterations. This resampling approach has two key strengths. First, as a non-parametric resampling method, it is applicable even in cases where the underlying distribution is non-Gaussian. Second, it allows us to account for potential temporal autocorrelation in the raw time series by using a block length greater than that of any statistically significant autocorrelation. The resampling approach, along with the calculation of statistical significance, is described in detail in the supplementary materials of Singh et al.
2.2. Relationship between extreme autumn fire weather and area burned
The area burned dataset described in the previous section allows us to quantify the trend and interannual climate-burned area relationships. In addition, to quantify the relationship between extreme daily-scale autumn fire weather and the area burned by individual wildfires, we use the fire database of individual wildfires occurring in non-desert and non-agricultural regions of California from Williams et al [12]. We query this dataset from 1979–2018 to identify relationships between daily FWI exceeding the locally-defined 95th percentile (FWI95; 'extreme fire weather') and the occurrence of very large autumn fires (herein defined as the largest 1% of autumn fires, or 54.25 km2). We calculate the 95th percentile threshold using data pooled over the calendar year during 1979–2018. We tabulate the maximum FWI over the first three days of each fire at the fire ignition location, as this often comprises a critical period where fires escape initial attack [55].
In addition, we quantify seasonal relationships between autumn area burned and the number of FWI95 days. Both measures are aggregated state-wide over the geographic region from Williams et al [12] to create annual time series. We calculate bivariate interannual correlations between the logarithm of autumn burned area and the number of FWI95 during 1984–2018 using both Pearson and Spearman correlation coefficients. As in previous studies, we use logarithms of burned area to overcome the exponential distribution of burned area records. Correlations are additionally calculated using detrended data to assess whether interannual relationships were strongly contingent on trends. Finally, we estimate average annual SON burned area for years where the state-wide FWI95 was above and below the 1984–2018 median (approximately 5.5 d). Given the heavily right skewed nature of burned area, we quantify uncertainty of these estimates through bootstrap resampling with replacement (n = 1000).
2.3. Simulated occurrence of extreme fire weather during the 20th and 21st centuries
We calculate daily FWI using the statistically downscaled (1/24th degree) maximum temperature, minimum relative humidity, wind speed, and precipitation fields from 18 CMIP5 models, described in [56]. These high-resolution fields are available for 1950–2005 in the CMIP5 Historical forcing, and 2006–2099 in the CMIP5 RCP4.5 and RCP8.5 forcing pathways. Together, they represent a unique, extremely high-resolution, daily-scale version of the CMIP5 ensemble. Although these high-resolution fields do not extend back to the late-19th/early-20th century (and therefore cannot be used to calculate changes in the probability of extreme autumn fire weather conditions since the Industrial Revolution), they do enable an unprecedented analysis of the spatial response of extreme fire weather to increases in climate forcing over the past half century, and projection of changes in multiple future climate forcing scenarios.
This high-resolution version of the CMIP5 dataset allows us to examine responses to two distinct future anthropogenic emissions scenarios: (i) a 'high emission' scenario (RCP8.5, which is the forcing most closely matching actual emissions over the past decade [57]), and (ii) a 'stabilization' scenario (RCP4.5, which is a forcing scenario slightly lower than that which would result from adherence to existing national commitments made as part of the Paris Agreement [58, 59]). While the RCP8.5 'high emissions' scenario is viewed by some as implausible, we include it in our analysis because, while the underlying socioeconomic assumptions and resultant energy portfolio underpinning the RCP8.5 scenario may be implausible, attainment of 'RCP8.5-like' warming may be possible even under lower emission trajectories if carbon cycle feedbacks are stronger than anticipated (e.g. [60]), and/or if climate sensitivity is higher than had previously been projected—as preliminary results from new CMIP6 simulations suggest is possible [61].
We harmonize this CMIP5 analysis with the analysis of observed extreme daily FWI (see previous section) by calculating the 95th percentile FWI value at each grid point across all calendar days during the CMIP5-simulated 1979–2018 period. We then calculate the mean frequency of occurrence of SON days that exceed the respective grid-point FWI95 threshold during 1950–2005 of the CMIP5 Historical simulations, along with 2006–2099 of the CMIP5 RCP4.5 and RCP8.5 simulations.
We use these high-resolution grid-point time series of autumn FWI95 days to conduct four analyses (shown in figures 4 and 5):
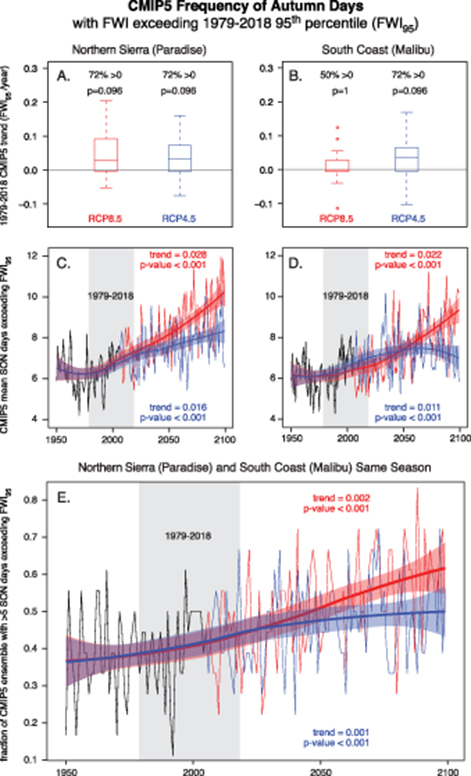
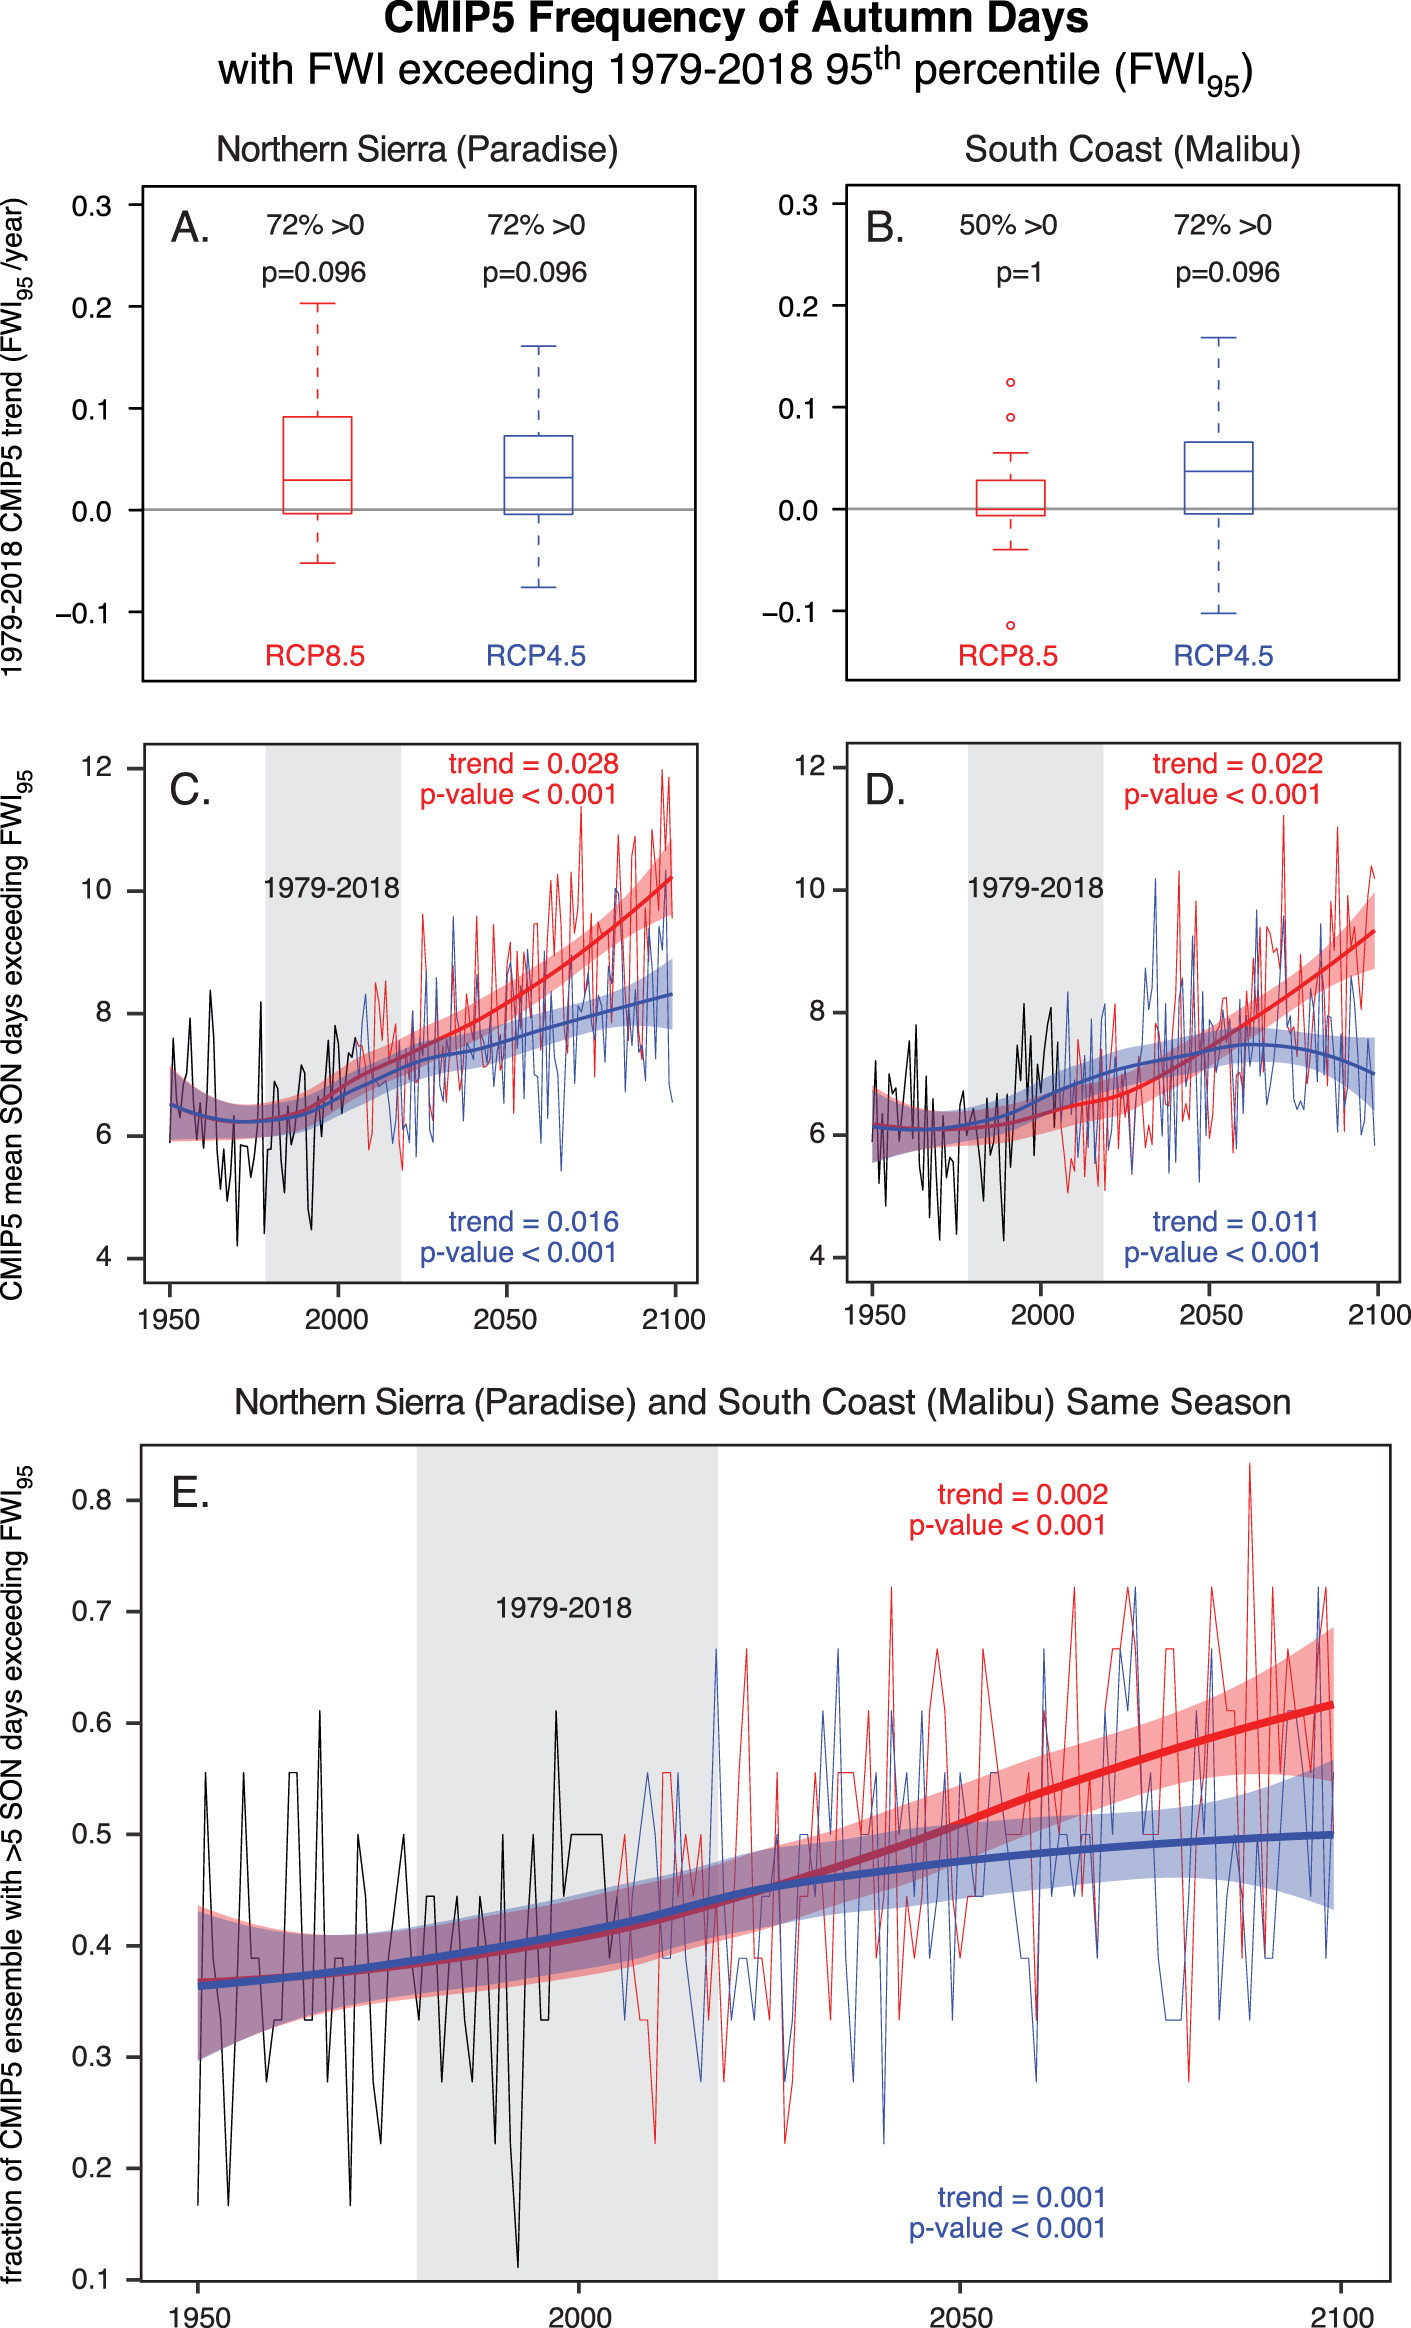
Figure 4. CMIP5-simulated historical change in extreme Fire Weather Index (FWI) values. (A), (B) The distribution of CMIP5 1979–2018 trends in autumn FWI95 days over the Northern Sierra (Paradise) and South Coast (Malibu) regions; the p-value compares the frequency of positive trends with the null probability of 0.5, as described in [62]. (C), (D) The CMIP5-mean autumn FWI95 occurrence for the Northern Sierra and South Coast regions for each year between 1950 and 2099 in the CMIP5 Historical (black), RCP4.5 (blue) and RCP8.5 (red) simulations. (E) The fraction of CMIP5 realizations for which both the Northern Sierra and South Coast regions experience >5 FWI95 days during the same autumn season, for each year between 1950 and 2099 in the CMIP5 Historical (black), RCP4.5 (blue) and RCP8.5 (red) simulations. Trends and p-values are calculated over the full 1950–2099 period using the block bootstrapping approach of Singh et al [50], which accounts for time dependency (see Methods). The bold regression lines and associated envelopes show the 95% confidence interval of a locally weighted regression ('loess').
Download figure:
Standard image High-resolution image
Figure 5. Projected changes in extreme FWI occurrence. Maps depict the ensemble-mean number of days per autumn season during which CMIP5-downscaled FWI exceeds the historical (1979–2018) 95th percentile for the past (1950–1979), present-era (2006–2035), mid-century future (2036–2065), and late-century future (2066–2090). Results are shown for two separate climate scenarios: a 'high warming' (RCP8.5) and 'warming stabilization' (RCP4.5) trajectory.
Download figure:
Standard image High-resolution image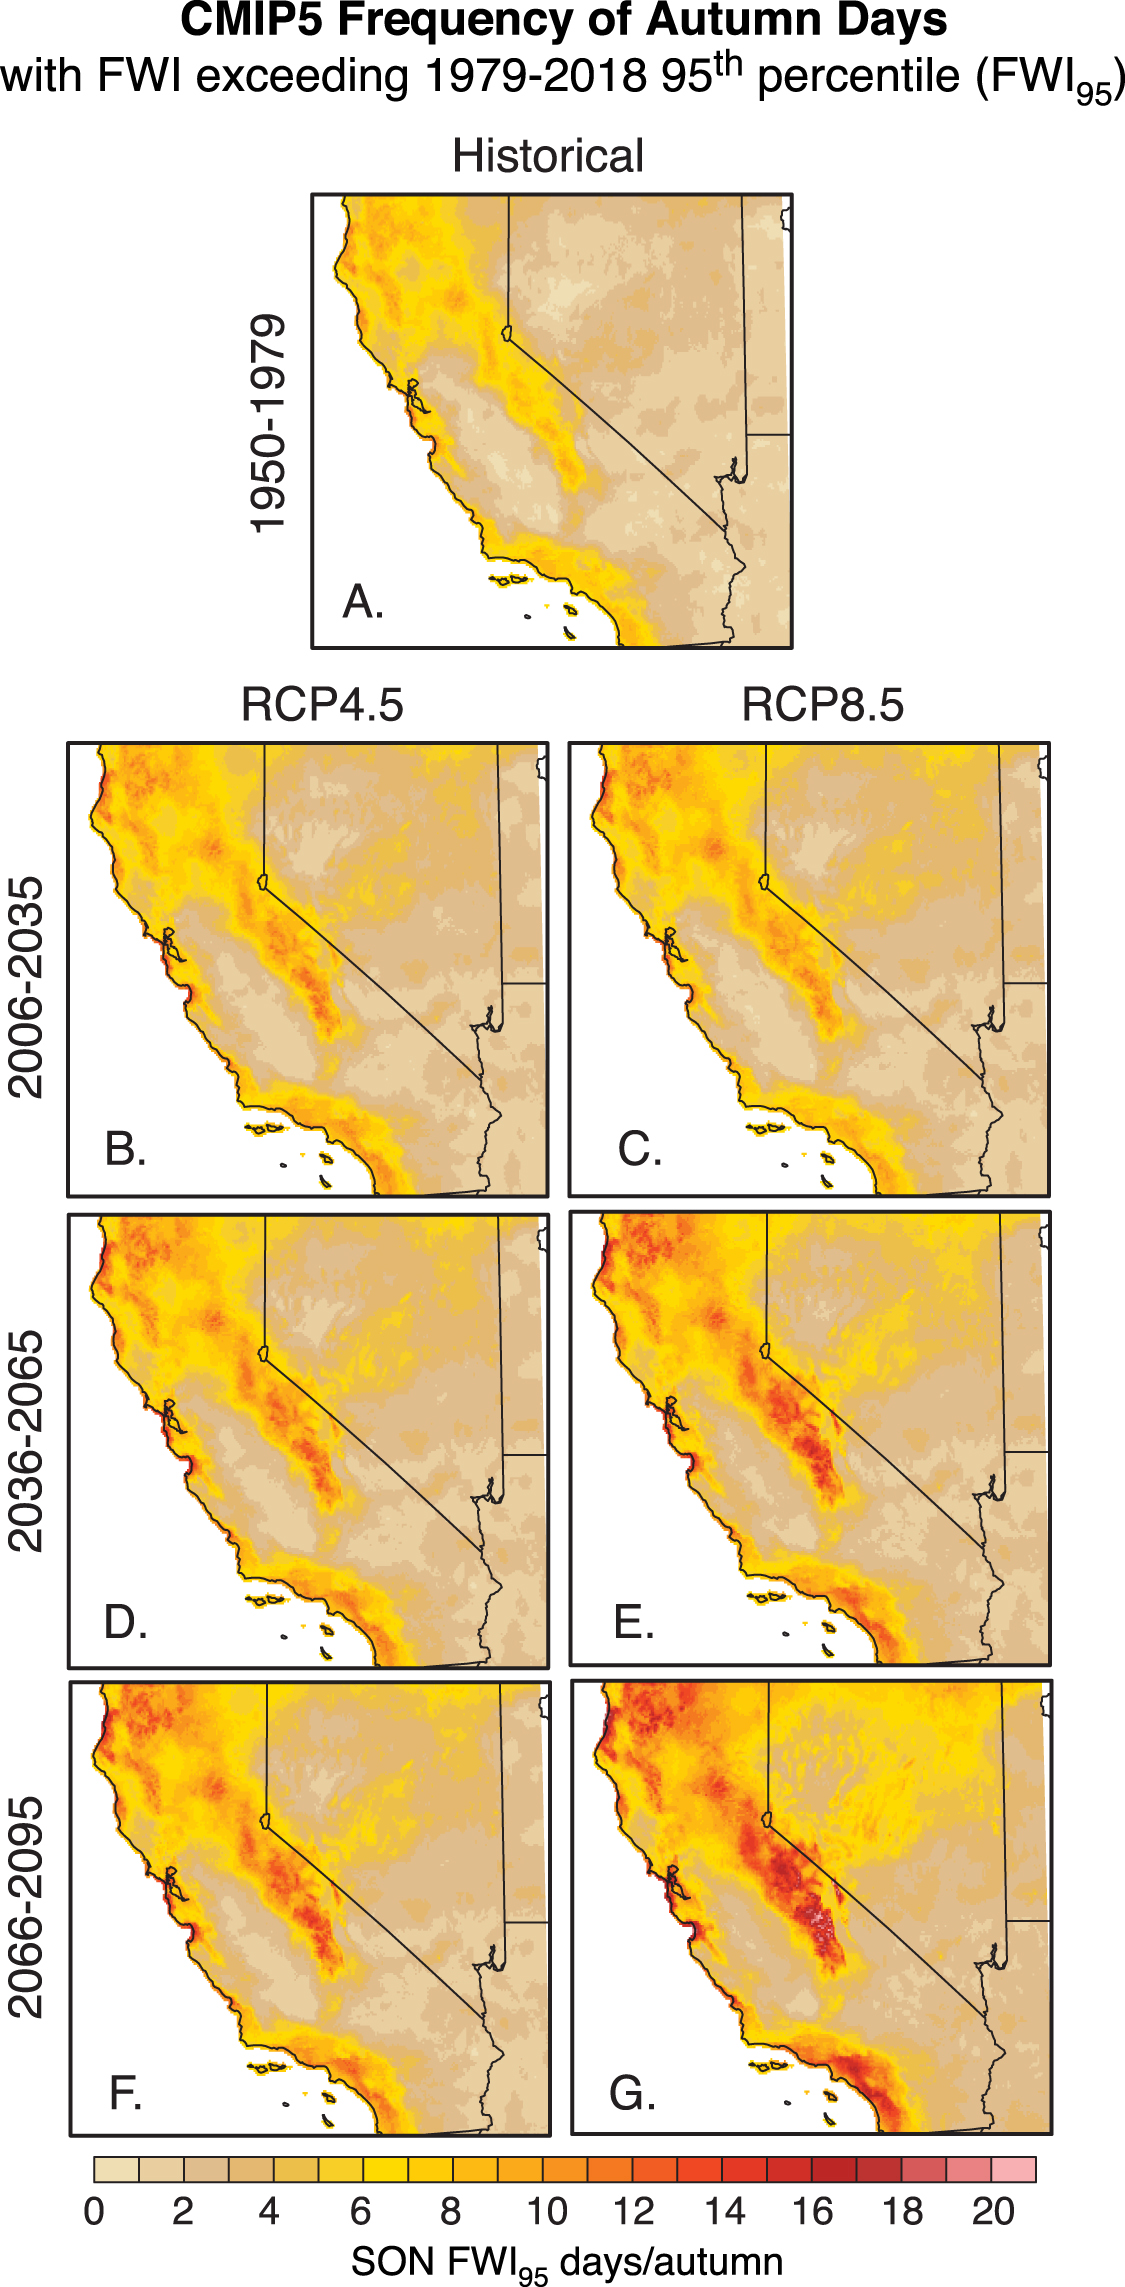
First, for each of the individual CMIP5 realizations, we calculate the 1979–2018 trend in autumn FWI95 days over the Northern Sierra (Paradise) and South Coast (Malibu) regions. As described in [62], we use a binomial test to compare the frequency of positive trends with the null hypothesis that in a stationary climate the probability of a positive multi-decadal trend is 0.5.
Second, for each year between 1950 and 2099 in the CMIP5 Historical, RCP4.5 and RCP8.5 simulations, we calculate the number of autumn FWI95 days in the Northern Sierra region, and the number of autumn FWI95 days in the South Coast region. Then, for each region, we calculate the mean of the CMIP5 values in each year, yielding an annual time series of CMIP5-mean autumn FWI95 occurrence for the Northern Sierra and South Coast regions.
Third, for each year between 1950 and 2099 in the CMIP5 Historical, RCP4.5 and RCP8.5 simulations, we identify each of the CMIP5 realizations for which both the Northern Sierra and South Coast regions experience >5 FWI95 days during autumn. We then calculate the fraction of the CMIP5 realizations meeting this criterion in each year, yielding an annual time series of the probability that both the Northern Sierra and South Coast regions experience >5 FWI95 days in the same autumn season.
Fourth, we calculate the mean occurrence of autumn FWI95 days at each of the high-resolution grid points during three 30-year periods of the CMIP5 RCP4.5 and RCP8.5 simulations: 2006–2035, 2036–2065 and 2066–2095. Together, these three periods span the cumulative emissions and global temperature changes of similar periods in RCP2.6 and RCP6.0, with all four RCPs overlapping closely during the early period [63].
3. Results and discussion
3.1. Observed trends in climate, fire weather, and area burned
Between 1979 and 2018, state-wide autumn trends were +0.30 °C/decade (p = 0.015) for temperature, −12.03 mm/decade (p = 0.095) for precipitation, and +0.39 standard deviations/decade (p = 0.002) for FWI (figure 1). Likewise, the trend in state-wide autumn burned area corresponded to an increase of ∼40% per decade during 1984–2018 (p = 0.036).
These state-wide trends are reflected more broadly throughout California, with most areas having experienced positive temperature trends (figure 2(A)), negative autumn precipitation trends, and positive autumn FWI trends (figure 2(C)) during 1979–2018. The Northern Sierra (Paradise) and South Coast (Malibu) regions have exhibited autumn temperature trends of +0.33 °C/decade (p = 0.012) and +0.34 °C/decade (p = 0.006), respectively, along with autumn precipitation trends of −24.08 mm/decade (p = 0.091) and −8.10 mm/decade (p = 0.126) (figure 2(D)). Further, strongly positive FWI trends have been observed for both the Northern Sierra (+0.40 standard deviations/decade; p = 0.002) and South Coast (+0.39 standard deviations/decade; p = 0.006) regions.
The autumn 2018 FWI value was the highest in the observed record for both the Northern Sierra and South Coast regions (figure 2(D)). However, those record FWI values were not associated with record SON temperature or precipitation in either region (figure 2(D)). This discrepancy highlights the fact that FWI incorporates build-up factors (e.g. summer aridity) that entrain some memory of summer conditions into early autumn, as well as the multivariate and nonlinear nature of FWI calculations.
The seasonal mean precipitation from the full October-November period may also not always represent on-the-ground moisture conditions coincident with fire activity, since individual large storms during mid-late November can occasionally offset critically dry antecedent conditions. In 2018, a series of Pacific storm systems brought widespread heavy rainfall and anomalously cool temperatures to California in the final ∼10 d of November. However, conditions from September through the first half of November were very warm and dry, which produced a period of extraordinarily high wildfire potential (figure 2(D)) during which both the Camp and Woolsey fires ignited and spread. Additionally, the record downslope-wind-driven Thomas Fire in 2017 ignited in early December [46], suggesting that future analyses may need to consider September-December, as the later onset of precipitation extends the autumn fire season later into the year. Although further research is needed to fully assess changes in the precise timing of cool-season precipitation onset, recent work suggests that projected sub-seasonal shifts in California precipitation ([17, 21–23, 29]; figure S2) have significant potential to interact non-linearly with changes in the seasonality of autumn offshore winds [64].
3.2. Observed relationships between extreme autumn fire weather and area burned
We find moderate interannual correlations between SON area burned and the mean number of SON days in which FWI exceeds the locally-defined 95th percentile (FWI95) (e.g. r > 0.35 for forest and non-forest area; Table S1). Correlations between SON burned area and FWI95 days are stronger than those between SON burned area and seasonal FWI, temperature, or precipitation. These weaker relationships to total SON burned area are consistent with prior studies [12, 65]. A matrix of additional factors ultimately shape autumn fire potential and realized fire activity, including live fuel moistures; sensitivity of short-term fuel abundance in grassland regions to the preceding winter/spring moisture availability (e.g. [66]); and the stochastic nature of synchronization between predominantly human-caused ignitions, critical fire weather conditions, and dry fuels.
Given the inherent limitations of the relationships between seasonal-scale climate variables and wildfire activity, we also analyze relationships with daily-scale fire weather conditions at the individual fire event level. Approximately 60% of the largest 1% of autumn fires during 1979–2018 started or were immediately followed within the first two days by extreme fire weather conditions. Further, we find substantially more area burned in SON seasons with greater frequency of FWI95 days. For instance, over the 1984–2018 period, the mean area burned for SON seasons in which the number of FWI95 days exceeded the median FWI95 frequency (5.5 d) was 528 km2 (95% range: 300–920 km2), compared with 222 km2 (95% range: 121–574 km2) for SON seasons in which the number of FWI95 days was less than the median frequency (figure 3(B)).
The occurrence of autumn FWI95 days has increased substantially in recent decades (figure 3(A)). Over the 1979–2018 period, the regional average number of SON FWI95 days exhibits a trend of +2.34 d/decade (p < 0.001). As a result, the mean number of days with extreme fire weather during the autumn season has more than doubled since the late 1970s. Further, 2005 was the last year in which the regional average fell below the 1979–2018 median value.
3.3. Response of extreme autumn fire weather to historical and future changes in climate forcing
Given the elevated probability of extensive area burned for autumn seasons with >5 FWI95 days (figure 3), we compare the frequency of FWI95 days—and seasons with >5 FWI95 days—for different periods of the CMIP5 historical and future climate simulations. During the 1979–2018 period, both the Northern Sierra and South Coast regions exhibit simulated increases in frequency of autumn FWI95 days, both in the mean of the CMIP5 realizations (figures 4(C), (D)), and in a majority of the individual realizations (figures 4(A), (B)). These increases in FWI95 days result in increases in the joint occurrence of years in which both the Northern Sierra and South Coast regions experience high FWI95 occurrence during the same autumn (figure 4(E)). For example, the CMIP5-mean simulated fraction of SON seasons in which there are >5 FWI95 days in both the Northern Sierra and South Coast regions increases from ∼0.35 to >0.40 between 1950 and 2018.
Simulated future changes in extreme FWI days are projected in both 'high warming' (RCP8.5) and 'warming stabilization' (RCP4.5) scenarios. Both the Northern Sierra and South Coast regions exhibit increases in mean FWI95 occurrence of >25% over the remainder of the 21st century in RCP8.5, reaching a mean of ∼10 d/autumn over the Northern Sierra and ∼9 d/autumn over the South Coast (figure 4(B)). The multi-model mean increases are reduced in RCP4.5, reaching a mean of ∼8 d/autumn over the Northern Sierra and ∼7 d/autumn over the South Coast (figure 4(B)). As a result, the projected fraction of autumn seasons in which both the Northern Sierra and South Coast experience >5 FWI95 days is reduced from ∼0.6 at the end of the 21st century in RCP8.5 to below 0.5 in RCP4.5.
The greater intensification of extreme wildfire weather in the 'high warming' RCP8.5 scenario is also reflected in much of the rest of California (figure 5). During the present era (2006–2035), RCP8.5 and RCP4.5 show similar increases in FWI95 occurrence, with the area experiencing >10 FWI95 days/autumn expanding over northern California, the Sierra Nevada, and the Pacific coast relative to the mid-20th century (1950–1979). By the mid-21st century (2036–2065), RCP8.5 exhibits a higher frequency of FWI95 days over many of the high-FWI regions, including much of northern California, the Sierra Nevada and the South Coast. These differences between RCP4.5 and RCP8.5 are further exacerbated in the late-21st century. Specifically, the frequency of FWI95 days is projected to remain below 15 d/autumn throughout almost all of the state in 2066–2095 of RCP4.5, but it is projected to exceed 15 d/autumn over many of the high-FWI regions in 2066–2095 of RCP8.5.
We emphasize that although the projected increases in extreme FWI are not spatially uniform, they are essentially ubiquitous across vegetated areas of California. In particular, we note 'hotspots' of extreme projected FWI increases in regions with very different vegetation regimes. For example, relative increases in extreme FWI frequency are broadly projected to exceed 50% by the late-21st century of RCP4.5 (relative to 1950–1979), and approach 100% in some regions by the late-21st century of RCP8.5 (figure 5). This finding strongly suggests that—at least from an extreme fire weather perspective—the direct influence of climate change on wildfire risk is not limited to California's forested regions, and instead extends across a diverse range of microclimates and ecoregions as long as fuel abundance is not limiting.
4. Conclusions
We report a substantial and statistically significant historical trend toward autumns which are increasingly conducive to enhanced wildfire risk across most of California. This observed increase in weather-driven autumn wildfire risk coincides with a strong and robust warming trend (+0.30 °C/decade; p = 0.015), and a modest negative precipitation trend (−12.03 mm/decade; p = 0.095) over the 1979–2018 period. Observations and climate model simulations suggest that the likelihood of Northern and Southern California simultaneously experiencing extreme autumn fire weather conditions has increased since the mid-20th century. Climate model simulations further suggest that continued warming and strengthening of seasonal drying trends in the future will likely result in further increases in extreme autumn fire weather conditions throughout California—even for a future climate scenario similar to that which would result from adherence to commitments made in the UN Paris Agreement [58, 59]. Collectively, this analysis offers strong evidence for a human fingerprint on the observed increase in meteorological preconditions necessary for extreme wildfires in California. Absent a strong decrease in autumn wind patterns, observed and projected temperature and precipitation trends portend increasing risk that autumn offshore wind events will coincide with critically dry fuels—increasing the potential for wildfire catastrophes when fires affect populated areas.
We note several caveats. First, the increases in wildfire probability that we quantify are based on links with FWI, but not on simulations of wildfire frequency. However, there are physical and empirical bases for the relationship with FWI (e.g. [67–69]) and our results help to further refine the linkage between the occurrence of extreme autumn fire weather and autumn area burned (figure 3; table S1). Second, although the high-resolution climate datasets enable analysis of historical and projected changes in extreme fire weather potential, gridded datasets are imperfect approximations of real-world weather conditions, climate trends, and the response of local climate to changes in forcing (including the mesoscale atmospheric dynamics that generate strong wind events). Third, there are uncertainties associated with internal low-frequency climate variability apparent in multi-decadal climate observations of simulations (e.g. [70]), especially with respect to precipitation trends [26], that may alter past and future multi-decadal trajectories of autumn extreme fire weather from those dictated by anthropogenic climate forcing alone. Additionally, we do not account for feedback mechanisms between climate, wildfire, and the biosphere. These could include negative climate-fire feedbacks that result from dynamic vegetation processes that lessen future fuel loads [71]—although positive climate-fire feedbacks are also plausible in some higher-frequency fire regimes and in regions where invasive grasses proliferate [72].
We also emphasize that climate change is only one of several factors driving California's multi-year wildfire disaster. Nearly 88% of fires and 92% of burned area from autumn wildfires in California are human-caused [73], highlighting human ignition sources as key contributors. However, the number of ignitions has declined over the past several decades [74]. In the present study, we do not quantify the relative role of increased urban and suburban incursion into the high-risk wildland-urban interface, nor the contribution of historical land/vegetation management practices to increasing wildfire risk or possible future climate-fire feedbacks. We note, however, that although demographics and vegetation exhibit high spatial heterogeneity, observed and projected climate trends relevant to wildfire risk (including temperature, precipitation, and FWI) are pervasive across California's major ecological zones, vegetation types, and fire regimes (e.g. [75]). California's mean climate is aridifying from a net water balance perspective [12]—primarily due to rising temperatures, but also with some contribution from the potentially narrowing seasonality and shifting temporal characteristics of precipitation [21, 30–32]. Increased aridity in semi-arid landscapes in California may alter fire-climate relationships, resulting in fuel-limited regimes in regions that become increasingly sensitive to interannual variations in biomass abundance, and less sensitive to the aridity of the vegetation itself (e.g. [76, 77]). A key consequence of climate change-driven aridification is that vegetation throughout the state is becoming increasingly flammable, setting the stage for extreme burning conditions given an ignition source and otherwise conducive weather conditions. Climate change can thus be viewed as a wildfire 'threat multiplier' amplifying natural and human risk factors that are already prevalent throughout California.
Observed and projected trends suggest that anthropogenic climate change has already facilitated conditions that are increasingly conducive to wildfire activity, and that continued global warming will continue to intensify those conditions in the future. Increased synchronicity of extreme fire danger between northern and southern California has the potential to hamper fire suppression and risk-reduction efforts, particularly as longer fire seasons increase fatigue among firefighters and evacuated residents alike. Absent substantial interventions, our results portend even greater potential for future wildfire disasters in California, placing further burdens on an already stressed global fire suppression network. In the long-term, reduction of global greenhouse gas emissions is the most direct path to reducing this risk, though the near-term impacts of these reductions may be limited given the many sources of inertia in the climate system [78]. Fortunately, a broad portfolio of options already exists, including the use of prescribed burning to reduce fuel loads and improve ecosystem health [79], upgrades to emergency communications and response systems, community-level development of protective fire breaks and defensible space, and the adoption of new zoning rules and building codes to promote fire-resilient construction [80]. Assessment of those options will require integration of perspectives from multiple disciplines in order to fully understand the complex ecological, meteorological and human interactions revealed during the recent wildfires in California.
Acknowledgments
We thank the editor and five anonymous reviewers for insightful and constructive feedback. We acknowledge the World Climate Research Programme's Working Group on Coupled Modelling, the U.S. Department of Energy's Program for Climate Model Diagnosis and Intercomparison, and the climate modeling groups for contributing their model output to CMIP5. Goss and Diffenbaugh were supported by Stanford University and the Department of Energy. Swain was supported by a joint collaboration between the Institute of the Environment and Sustainability at the University of California, Los Angeles; the Center for Climate and Weather Extremes at the National Center for Atmospheric Research; and the Nature Conservancy of California. Kolden and Abatzoglou were partially supported by the National Science Foundation under DMS-1520873. Williams was supported by the Zegar Family Foundation.
Data availability
The data that support the findings of this study are available from the corresponding author upon reasonable request. Observed temperature, precipitation and FWI data were obtained from the gridMET dataset (www.climatologylab.org/gridmet.html). Climate model temperature and precipitation data, as well as all other underlying variables required to calculate FWI, were obtained from the CMIP5 archive (accessible via the Earth System grid at https://esgf-node.llnl.gov/projects/cmip5/). Downscaled climate data used to calculate FWI were obtained from the Multivariate Adaptive Constructed Analogs archive (www.climatologylab.org/maca.html). A database of daily downscaled FWI covering the region 32.5-42N, 113-125W will be made available at www.climatologylab.org. Time series of temperature, precipitation, Fire Weather Index and burned area plotted in figures 1 and 2 are available in supplementary data file 1 of this paper.