 RSS Feed
 by Calculated Risk on 4/16/2025 11:29:00 AM
Wednesday, April 16, 2025
CoStar: US inbound international travel takes 12% hit
From CoStar: US inbound international travel takes 12% hit as economists postpone pre-pandemic recovery to 2029
Whatever hopes the travel industry had in a full recovery to 2019 levels of travel bookings this year have officially been dashed, according to one economist.
"Our pre-inauguration forecast expected international travel to nearly fully recover in 2025 to 2019 levels. We're now pushing that out to 2029," Adam Sacks, president at Tourism Economics, said on a webinar Tuesday. "Now we're looking at a full 10 years between pre-pandemic and what will be full recovery. And, of course, that comes with significant economic losses."
...
The U.S. is already seeing a decline in international travelers, Sacks said. According to National Travel and Tourism Office data, overseas visitor arrivals into the U.S. in March dropped 11.6% year over year.

"What we see is that the things that have really affected international [travel] — it has as much to do with words as it does with action," Sacks said. "It's not only policy, it is rhetoric, the trade war itself, it needs to be said, it's intrinsically combative. It's called a war."
Not only are Trump's tariffs effecting global sentiment, but the way he speaks of commandeering other countries, reduced support for Ukraine and enforces deportations is driving off travelers.
While domestic travel should still remain strong, maybe even buoyed by Americans staying closer to home, the drop in international travel is "not going to fully compensate for the losses," Sacks said.
NAHB: "Builder Confidence Levels Indicate Slow Start for Spring Housing Season" in April
by Calculated Risk on 4/16/2025 10:00:00 AM
The National Association of Home Builders (NAHB) reported the housing market index (HMI) was at 40, up from 39 last month. Any number below 50 indicates that more builders view sales conditions as poor than good.
From the NAHB: Builder Confidence Levels Indicate Slow Start for Spring Housing Season
Growing economic uncertainty stemming from tariff concerns and elevated building material costs kept builder sentiment in negative territory in April, despite a modest bump in confidence likely due to a slight retreat in mortgage interest rates in recent weeks.
Builder confidence in the market for newly built single-family homes was 40 in April, edging up one point from March, according to the National Association of Home Builders (NAHB)/Wells Fargo Housing Market Index (HMI) released today.
“The recent dip in mortgage rates may have pushed some buyers off the fence in March, helping builders with sales activity,” said NAHB Chairman Buddy Hughes, a home builder and developer from Lexington, N.C. “At the same time, builders have expressed growing uncertainty over market conditions as tariffs have increased price volatility for building materials at a time when the industry continues to grapple with labor shortages and a lack of buildable lots.”
“Policy uncertainty is having a negative impact on home builders, making it difficult for them to accurately price homes and make critical business decisions,” said NAHB Chief Economist Robert Dietz. “The April HMI data indicates that the tariff cost effect is already taking hold, with the majority of builders reporting cost increases on building materials due to tariffs.”
When asked about the impact of tariffs on their business, 60% of builders reported their suppliers have already increased or announced increases of material prices due to tariffs. On average, suppliers have increased their prices by 6.3% in response to announced, enacted, or expected tariffs. This means builders estimate a typical cost effect from recent tariff actions at $10,900 per home.
...
The HMI index gauging current sales conditions rose two points in April to a level of 45. The gauge charting traffic of prospective buyers increased one point to 25 while the component measuring sales expectations in the next six months fell four points to 43.
Looking at the three-month moving averages for regional HMI scores, the Northeast fell seven points in April to 47, the Midwest moved one point lower to 41, the South dropped three points to 39 and the West posted a two-point decline to 35.
emphasis added
 Click on graph for larger image.
This graph shows the NAHB index since Jan 1985.
This was slightly above the consensus forecast.
Industrial Production Decreased 0.3% in March
by Calculated Risk on 4/16/2025 09:15:00 AM
From the Fed: Industrial Production and Capacity Utilization
Industrial production (IP) decreased 0.3 percent in March but increased at an annual rate of 5.5 percent in the first quarter. The March decline was led by a 5.8 percent drop in the index for utilities, as temperatures were warmer than is typical for the month. In contrast, the indexes for manufacturing and mining grew 0.3 percent and 0.6 percent, respectively. At 103.9 percent of its 2017 average, total IP in March was 1.3 percent above its year-earlier level. Capacity utilization stepped down to 77.8 percent, a rate that is 1.8 percentage points below its long-run (1972–2024) average.
emphasis added
 Click on graph for larger image.
This graph shows Capacity Utilization. This series is up from the record low set in April 2020, and close to the level in February 2020 (pre-pandemic).
Capacity utilization at 77.8% is 1.8% below the average from 1972 to 2023. This was below consensus expectations.
Note: y-axis doesn't start at zero to better show the change.
 The second graph shows industrial production since 1967.
Industrial production decreased to 103.9. This is above the pre-pandemic level.
Industrial production was at consensus expectations.
Retail Sales Increased 1.4% in March
by Calculated Risk on 4/16/2025 08:30:00 AM
On a monthly basis, retail sales increased 1.4% from February to March (seasonally adjusted), and sales were up 4.6 percent from March 2024.
From the Census Bureau report:
Advance estimates of U.S. retail and food services sales for March 2025, adjusted for seasonal variation and holiday and trading-day differences, but not for price changes, were $734.9 billion, up 1.4 percent from the previous month, and up 4.6 percent from March 2024. ... The January 2025 to February 2025 percent change was unrevised from up 0.2 percent.
emphasis added
 Click on graph for larger image.
This graph shows retail sales since 1992. This is monthly retail sales and food service, seasonally adjusted (total and ex-gasoline).
Retail sales ex-gasoline was up 1.7% in March.
The second graph shows the year-over-year change in retail sales and food service (ex-gasoline) since 1993.
Retail and Food service sales, ex-gasoline, increased by 5.2% on a YoY basis.
 The change in sales in March were slightly above expectations, and sales in January and February were revised up, combined.
MBA: Mortgage Applications Decrease in Latest MBA Weekly Survey
by Calculated Risk on 4/16/2025 07:00:00 AM
From the MBA: Mortgage Applications Decrease in Latest MBA Weekly Survey
Mortgage applications decreased 8.5 percent from one week earlier, according to data from the Mortgage Bankers Association’s (MBA) Weekly Mortgage Applications Survey for the week ending April 11, 2025.
The Market Composite Index, a measure of mortgage loan application volume, decreased 8.5 percent on a seasonally adjusted basis from one week earlier. On an unadjusted basis, the Index decreased 8 percent compared with the previous week. The Refinance Index decreased 12 percent from the previous week and was 68 percent higher than the same week one year ago. The seasonally adjusted Purchase Index decreased 5 percent from one week earlier. The unadjusted Purchase Index decreased 4 percent compared with the previous week and was 13 percent higher than the same week one year ago.
“Mortgage rates moved 20 basis points higher last week, abruptly slowing the pace of mortgage application activity with refinance volume dropping 12 percent and purchase volume falling 5 percent for the week. Purchase volume remains almost 13 percent above last year’s level, but economic uncertainty and the volatility in rates is likely to make at least some prospective buyers more hesitant to move forward with a purchase,” said Mike Fratantoni, MBA’s SVP and Chief Economist. “One notable change last week was the full percentage point increase in the ARM share. Given the jump in rates, more borrowers are opting for the lower initial rates that come with an ARM, with initial fixed rates closer to 6 percent in our survey last week. The ARM share at 9.6 percent was the highest since November 2023, and this reflects the share of units. On a dollar basis, almost a quarter of the application volume last week was for ARMs, as borrowers with larger loans are even more likely to opt for an ARM.”
...
The average contract interest rate for 30-year fixed-rate mortgages with conforming loan balances ($806,500 or less) increased to 6.81 percent from 6.61 percent, with points decreasing to 0.62 from 0.63 (including the origination fee) for 80 percent loan-to-value ratio (LTV) loans.
emphasis added
 Click on graph for larger image.
The first graph shows the MBA mortgage purchase index.
According to the MBA, purchase activity is up 13% year-over-year unadjusted.
Red is a four-week average (blue is weekly).
Purchase application activity is up about 31% from the lows in late October 2023 and is 9% above the lowest levels during the housing bust.

The second graph shows the refinance index since 1990.
The refinance index decreased.
Tuesday, April 15, 2025
Wednesday: Retail Sales, Industrial Production, Homebuilder Survey, Fed Chair Powell
by Calculated Risk on 4/15/2025 07:55:00 PM
 Note: Mortgage rates are from MortgageNewsDaily.com and are for top tier scenarios.
Wednesday:
• At 7:00 AM ET, The Mortgage Bankers Association (MBA) will release the results for the mortgage purchase applications index.
• At 8:30 AM, Retail sales for March is scheduled to be released. The consensus is for a 1.3% increase in retail sales.
• At 9:15 AM, The Fed will release Industrial Production and Capacity Utilization for March. The consensus is for a 0.3% decrease in Industrial Production, and for Capacity Utilization to decrease to 77.9%.
• At 10:00 AM, The April NAHB homebuilder survey. The consensus is for a reading of 38, down from 39. Any number below 50 indicates that more builders view sales conditions as poor than good.
• At 1:30 PM, Speech, Fed Chair Jerome Powell, Economic Outlook, At the Economic Club of Chicago, Chicago, Ill.
Las Vegas in February: Visitor Traffic Down 11.9% YoY; Convention Traffic Down 19.5% YoY
by Calculated Risk on 4/15/2025 02:38:00 PM
From the Las Vegas Visitor Authority: February 2025 Las Vegas Visitor Statistics
With the combined factors of a tough comparison to last year when Super Bowl LVIII was held in the destination, a net decrease in the convention segment tied to rotation cycles, and one fewer day on the calendar compared to the 2024 leap year, visitation fell below 3.0M for the month, down ‐11.9% YoY.
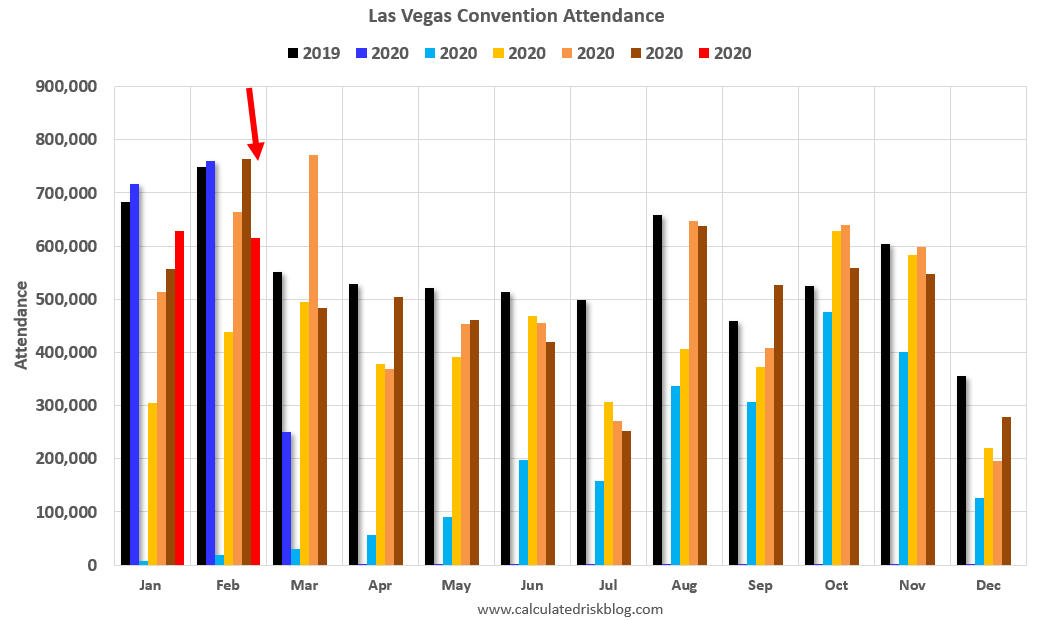
Las Vegas convention attendance reached roughly 615k in February, down ‐19.5% YoY, reflecting in part the calendar impact of World Market Center's Winter show (38k attendees) and Total Product Expo (8k attendees) ending in Jan this year vs. Feb last year, plus show rotations of Int'l Roofing Expo (15k attendees) and National Automobile Dealers Assn (22k attendees) which were held elsewhere this year.
Occupancy reached 80.5%, down ‐3.4 pts with Weekend occupancy of 86.4% (down ‐3.9 pts) and Midweek occupancy of 77.7% (down ‐3.3 pts.) ADR for the month reached $186 (‐25% YoY) with RevPAR of $150 (‐28% YoY).
emphasis added
 Click on graph for larger image.
 The first graph shows visitor traffic for 2019 (Black), 2020 (dark blue), 2021 (light blue), 2022 (light orange), 2023 (orange), 2024 (dark orange) and 2025 (red).
Visitor traffic was down 11.9% compared to last February. Visitor traffic was down 6.8% compared to February 2019.
The second graph shows convention traffic.
3rd Look at Local Housing Markets in March
by Calculated Risk on 4/15/2025 11:34:00 AM
Today, in the Calculated Risk Real Estate Newsletter: 3rd Look at Local Housing Markets in March
A brief excerpt:
This is the third look at several early reporting local markets in March. I’m tracking over 40 local housing markets in the US. Some of the 40 markets are states, and some are metropolitan areas. I’ll update these tables throughout the month as additional data is released.There is much more in the article.
Closed sales in March were mostly for contracts signed in January and February when 30-year mortgage rates averaged 6.96% and 6.84%, respectively (Freddie Mac PMMS). This was an increase from the average rate for homes that closed in February. This was before the recent surge in economic uncertainty and stock market volatility that might impact existing home sales.
...
Here is a look at months-of-supply using NSA sales. Since this is NSA data, it is likely months-of-supply will increase into the Summer.
Months in red are areas that are seeing 5+ months of supply now and might see price pressures later this summer.
...
Many more local markets to come!

U.S. Demographics: Largest 5-year cohorts, and Ten most Common Ages in 2024
by Calculated Risk on 4/15/2025 08:11:00 AM
Eleven years ago, I wrote: Census Bureau: Largest 5-year Population Cohort is now the "20 to 24" Age Group. Those people are now in the 30 to 34 cohort.
This month the Census Bureau released the population estimates for July 2024 by age, and I've updated the table from the previous posts.
The table below shows the top 10 cohorts by size for 2010, 2024 (just released), and the most recent Census Bureau projections for 2030.
In 2024, the top 6 cohorts were under 45 (the Boomers are fading away), and by 2030 the top 7 cohorts will be under 50. Note: This is using the 2023 projections main series.
There will be plenty of "gray hairs" walking around in 2030, but the key for the economy is the large cohorts in the prime working age.
As I noted in 2014, demographics were positive for apartments, and more recently positive for homeownership.
| Population: Largest 5-Year Cohorts by Year | ||||
|---|---|---|---|---|
| Largest Cohorts | 2010 | 2024 | 2030 | |
| 1 | 45 to 49 years | 30 to 34 years | 35 to 39 years | |
| 2 | 50 to 54 years | 35 to 39 years | 30 to 34 years | |
| 3 | 15 to 19 years | 25 to 29 years | 25 to 29 years | |
| 4 | 20 to 24 years | 20 to 24 years | 40 to 44 years | |
| 5 | 25 to 29 years | 15 to 19 years | 20 to 24 years | |
| 6 | 40 to 44 years | 40 to 44 years | 45 to 49 years | |
| 7 | 10 to 14 years | 60 to 64 years | 15 to 19 years | |
| 8 | 5 to 9 years | 10 to 14 years | 50 to 54 years | |
| 9 | Under 5 years | 50 to 54 years | 65 to 69 years | |
| 10 | 35 to 39 years | 55 to 59 years | 10 to 14 years | |

Click on graph for larger image.
This graph, based on the 2024 population estimate, shows the U.S. population by age in July 2024 according to the Census Bureau.
Note that the largest age group is in the early-to-mid 30s. There are still a number of younger Boomers in their early-to-mid 60s.
Monday, April 14, 2025
Tuesday: NY Fed Mfg
by Calculated Risk on 4/14/2025 07:54:00 PM
 From Matthew Graham at Mortgage News Daily: Mortgage Rates Fall Back Below 7%
Last Friday was notable in that it was the first day since February 19th where the average top tier 30yr fixed mortgage rate ended the day over 7%. Last week was also notable for ranking among the more abrupt weeks for rising rates over the past few years.Tuesday:
Things are getting off to a friendlier start in the present week with the 30yr fixed rate index edging back below 7%--roughly in line with levels seen last Wed/Thu. [30 year fixed 6.98%]
emphasis added
• At 8:30 AM ET, The New York Fed Empire State manufacturing survey for April. The consensus is for a reading of -10.0, up from -20.0.


