
When Bond Prices Are a Matter of Opinion
A look at how different firms price the same bonds, including corporate bonds, Treasury bonds, and more.
/s3.amazonaws.com/arc-authors/morningstar/1b991ddd-b85f-490e-8687-e60e3f136800.jpg)
The SEC has mandated a new filing for investment companies under the elegant name N-PORT. (It's all relative.) The good news is that it provides a richer, more consistent collection of data that allows for better comparisons of mutual fund portfolios. The new form can be more truly considered an electronic document than most other SEC filings, and the list of portfolio-specific data that firms must include is more extensive and practical than almost anything they've been required to provide before. The filing makes possible a range of research that would have been much more difficult to do in the past, and one key benefit is that its standardization allows us to reliably look at and compare bond holdings across funds and their asset managers.
We have dipped our toes in that water by using N-PORT data to impute and compare bond prices across funds and included an analysis of our results in a paper titled "Bond Pricing: Agreeing to Disagree." We focused on bonds in particular because most just don't trade that often. The bond market operates in a different paradigm than stocks, which mostly trade on exchanges at lightning-fast speeds and incredibly high trading volumes. On an average day, U.S. equity markets regularly trade more than $500 billion worth of stock. U.S. corporate bonds? Maybe $25 billion to $30 billion. Other segments even less. In fact, of all the corporate bonds that traded in 2019, only a bit more than half of them traded at least once every three weeks throughout the year. (Morningstar Direct clients can download the full research report here.)
Figuring out what those bonds are worth when they aren't trading is a huge challenge. Every time an investor purchases or sells shares in a fund, the transaction has to be done based on the value of the whole portfolio. If underlying security prices are higher than they should be, investors selling shares will get more than they're entitled to, while those buying will wind up paying more, and vice versa.
The ultimate responsibility for bond pricing falls to funds' boards of directors, which usually work with asset managers in choosing pricing services to provide data that will be used to value their portfolios. That generally means using a group of services--sometimes selected based on acumen in specific sectors--and setting up a so-called pricing waterfall for custodians to follow in case there's a problem with one service's price. The numbers on which they settle are used to value securities across all of an asset manager's portfolios.
Our goal was to look at how much those prices differed in the filings of different firms' funds. After crunching individual bonds' prices (we imputed them using remaining principal and market values from funds' N-PORT forms), we looked at those appearing in more than one fund and compared them by measuring the widest range of prices for each bond. We divided that figure by the mean average of all the prices we observed to come up with what we call a price-spread percentage. (We include a more detailed explanation of our methodology in the paper, available to Morningstar Direct users.)
We looked at several sectors including Treasuries, mortgages, corporate bonds, asset-backed securities, and others, and we wholly expected to find dispersion among bond prices. There are simply too many bonds of too many stripes for pricing to be entirely consistent across pricing services and asset-management firms. There are also differences in practices among firms, such as whether their bond pricing is based on the bid, ask, or midprice offered by a service. Such decisions may not create a significant problem but could still cause some data to skew slightly in one direction or another, particularly at the firm level. Overall, we also expected that the more diffuse a sector in terms of issues and issuers, the more dispersion we would find, and vice versa.
But while that turns out to be the general trend, it's not axiomatic.
For each of the color-coded ratings groups below, there are boxes whose left and right sides illustrate where the 25th and 75th percentiles--a so-called interquartile range, or IQR--of price-spreads, as we've defined them. The thin lines extending to the left and right of the boxes (sometimes referred to as whiskers) represent data in each direction that stretch no more than 1.5 times the range described by the box, while individual dots represent outliers that go beyond that range. This chart shows a box-plot example for corporate bond price spreads from the last day of September 2019.
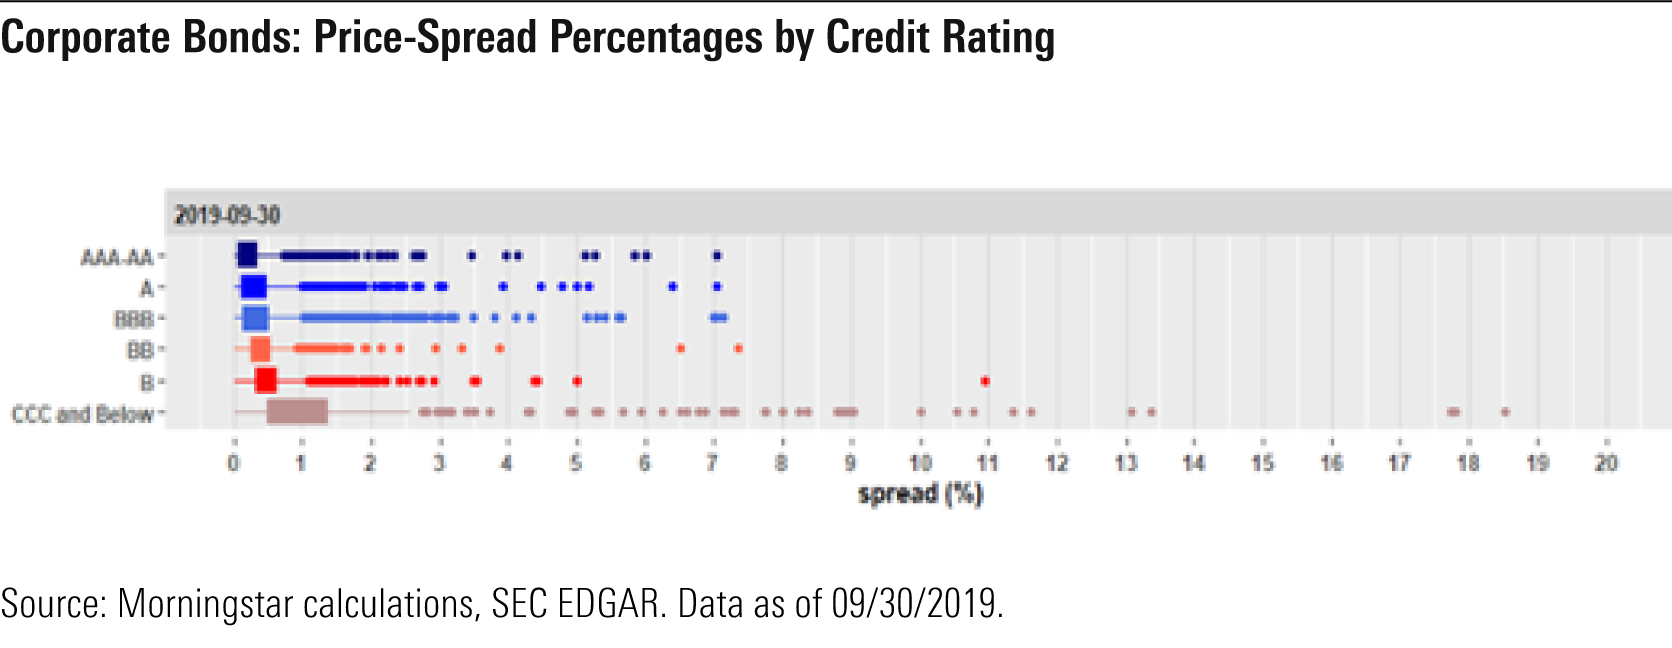
Although we expected a lot of clustering--there are several pricing services favored by the largest mutual fund complexes--we saw data that surprised us right off the bat. The price-spread ranges we observed for corporate bonds in the AAA-AA bucket were on the whole fairly tight. But even in that group there were roughly 150 bonds, held by an average of more than seven firms, with price-spread ranges larger than 0.50%.
Not surprisingly, it was 2020's first quarter that provided the real fireworks. The pandemic-triggered sell-off that began in late February sent a severe shock through nearly every layer of the bond market. That shock was shorter-lived than many others of the past given how aggressively the Federal Reserve and U.S. Treasury responded, and many markets began to recover in late March. Even so, data from the end of the month provided a snapshot of how shaken and disjointed markets remained. The chart below shows the average among price-spread percentages as of March 31, 2020, for the same ratings groups.
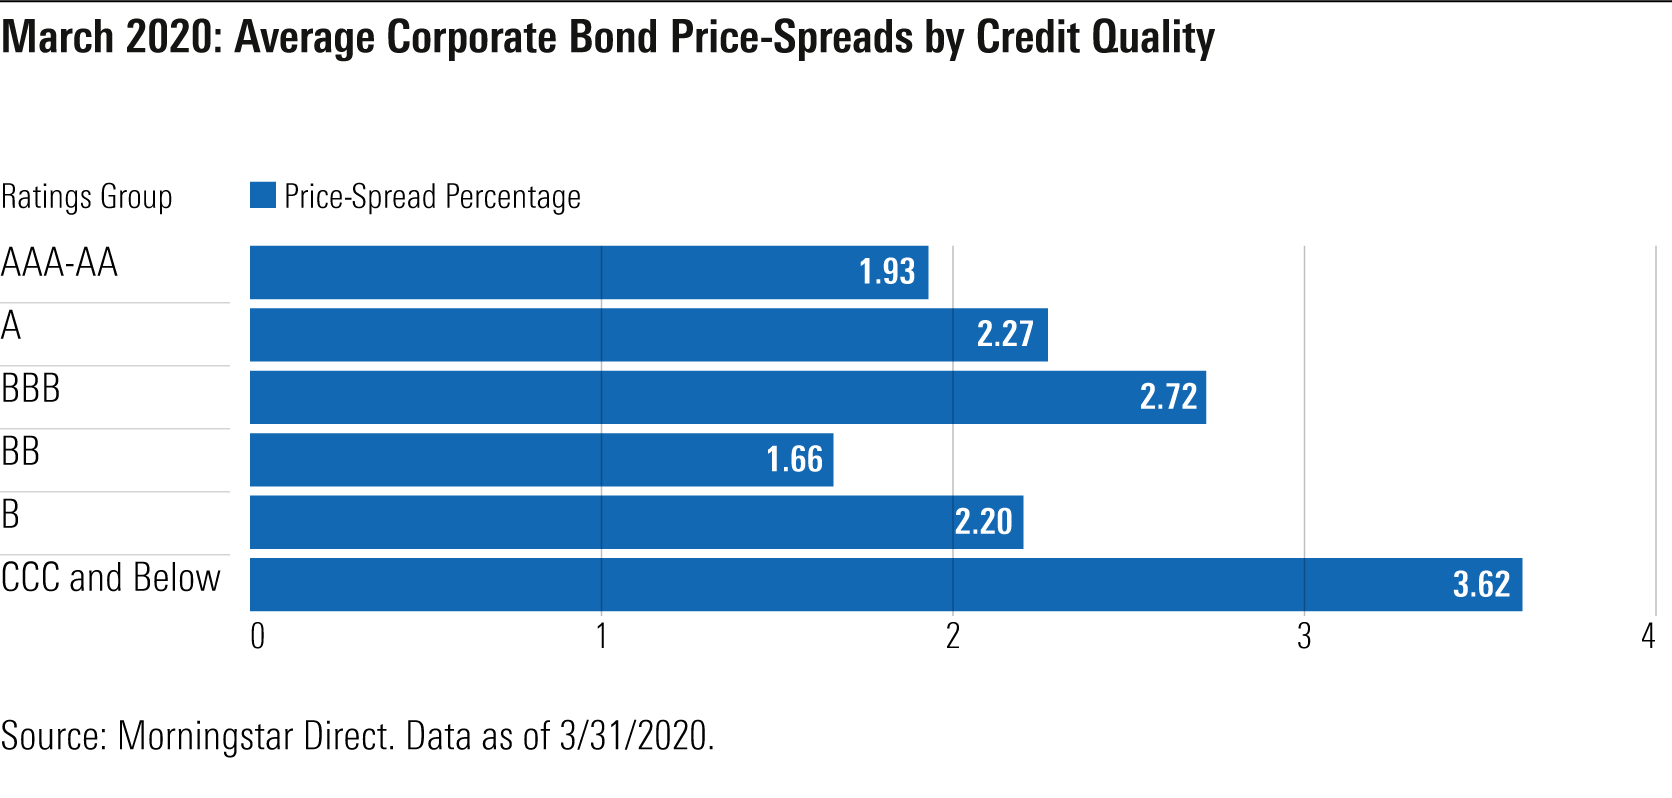
On the whole, we consider our results to be noteworthy for the fact that individual bond prices used by mutual fund complexes appear to differ much more widely and distinctly than we would have expected--even during periods of relative calm--given the modest handful of mainstream third-party pricing services generally used by most mutual fund complexes. Of course, nearly every portfolio manager we cover has agreed that the early 2020 trouble was one of the most unusual bond sell-offs in decades. The bond pricing data we were able to glean using form N-PORT has truly underscored that. The uncertainty surrounding bond prices in periods of severe market stress, such as the onset of the coronavirus pandemic, can be extraordinary.
N-PORT has decidedly improved our ability to observe the way shifting markets affect bond prices. We expect this to be just the first among other studies for which we will use data from those fillings. In fact, the aforementioned bond-pricing paper includes a brief look at how the differences we've observed played out at the fund company level. We plan to expand on that research, to examine how bond-level valuations affect those of mutual funds themselves, and, when we find interesting results, to share them. Stay tuned.
To explore more from our analysis on bond pricing, and the ins and outs of using N-PORT, sign up for our webinar.
:quality(80)/cloudfront-us-east-1.images.arcpublishing.com/morningstar/OMVK3XQEVFDRHGPHSQPIBDENQE.jpg)