Powell Calls Time on ‘Transitory’: Authers’ Indicators
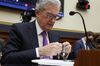
Now it’s official. Jerome Powell, re-nominated for another four years at the helm of the Federal Reserve, says that it’s time to “retire the word transitory.” Those words were a confirmation of what many had already grasped—that the sharply rising prices of 2021 have been driven by factors that aren’t purely transient. But official recognition led to some extraordinary shifts in inflationary psychology, as market estimates of future inflation plunged.
Perhaps the most influential measure of the market’s estimates with the Fed is the five-year/five-year breakeven, predicting average inflation for the five years starting five years hence (so, at present, from 2026 to 2031). According to the bond market, inflation over that period will average 2.22%—exactly what the market was predicting seven months ago. Over the year so far, using the latest figure, predicted 2026-31 inflation has risen from 1.97% to 2.11%. Meanwhile, the current headline inflation rate for the U.S. has risen from 1.36% to 6.22%. Some estimates, which have garnered a lot of attention, suggest that the inflation rate for November, due for release Friday, could top 7% for the first time since 1984.
Thus the market remains convinced that if the Fed wants to squelch inflation, it can. The question is whether that confidence is justified, and to answer it we need to know what has been driving inflation so far.
The Bloomberg inflation indicators are helpful in assessing the stakes. There are 35 in all, each represented by one rectangle in the heat map. The higher, or more inflationary, an indicator is by comparison to its norm over the last decade, the darker blue it will appear. They offer our best attempt to sum up the evidence on either side of the debate and, despite the recent alarm in the markets, that debate remains finely balanced.
It’s been clear for a while that inflation isn’t “transitory” in any meaningful sense. The many deep blue rectangles currently on display show broad overall inflationary pressure. But this doesn’t prove that the inflation will persist, or rise significantly from here. The continuing pale areas on the heat map show that the pressure could have been far more serious.
It’s also important to be clear about the parameters here. Nothing in these indicators suggests anything about “hyperinflation” as seen in Zimbabwe, or Weimar Germany. And markets have never predicted anything near as bad as the inflation of the 1970s. These indicators are designed to look at the last decade, when inflation was persistently low and allowed for historically low interest rates. It’s hard to deny that era is now over. But the market thinks that the Fed, now focusing on inflation for the first time in decades, can deal with the problem.
It’s easiest to look at the rectangles that aren’t dark blue to see where inflation pressures are not apparent. Inflation for medicine and college tuition is below average for the last decade; the same is true of agricultural prices. The wages of the highly skilled aren’t rising at any unusual rate, and wage gains in general, while rising, are still not gaining at the kind of rate that might justify talk of a “wage-price spiral.” Indeed, last week’s average hourly earnings numbers showed a slight decline in the rate of wage growth.
As commodity prices begin to come down, or merely stabilize, headline inflation numbers will start to decline automatically, as they’ll be compared with a steadily rising base from 12 months earlier. The sharp reversal in energy markets is thus positive. But there are still difficult tasks ahead for Powell and his colleagues. In the labor market, will wage demands start to reflect the inflation news? And if they do, will companies respond by raising prices, or by letting their profit margins decline? And in the property market, which accounts for a third of the index, will rents continue to increase? If they do, it will be very hard to bring inflation down to the Fed’s target range. But for the time being, Powell acknowledges there’s a problem, and the bond market is sure he can deal with it.
Numbers are current as of the close on Monday, Dec. 06. We will update them next week.
For Bloomberg Economics’ excellent and wide-ranging heat map of the economic factors behind inflation, read here
Authers’ Indicators
Official Measures Have Come Untethered
Click or tap on the indicator to launch it on the Terminal.👆
The 6.2% headline level of October consumer price inflation was higher than anyone had expected, and quashed debate over whether this is a serious problem. The Fed’s preferred measure of inflation, the core personal consumption expenditure, or PCE, deflator, remains at its highest level since 1991 and is still increasing. Producer price inflation, as 12.1%, is running at the highest level in four decades. But most important was the lesser known “trimmed mean” measure, which excludes goods that have suffered the most extreme changes in price in both directions, and is held to be a good indicator of the breadth of inflationary pressure. At 4.1% for October, it is now looking more extreme than any of the headline measures, and is more than five standard deviations above the norm for the last decade.
Why these indicators? ℹ
The crucial measures for monetary policy are the official government measures of inflation, mostly published monthly. The consumer price index, or CPI, includes everything in the Bureau of Labor Statistics’ basket. The producer price index, or PPI, measures prices paid by producers for making goods. Core CPI excludes fuel and food prices, which are more variable than most and, to an extent, beyond the reach of monetary policy. The trimmed mean CPI is another measure of “core” inflation in which the biggest outliers in both directions are excluded, with the average taken of the rest; this can compensate for the fact that prices in many products are “lumpy” and can in practice only be raised once or twice a year. Finally, the PCE deflator, which is compiled as part of the calculations for GDP, is the measure most closely watched by the Fed. It takes into account an even broader range of prices and is based on surveys of businesses rather than consumers.
Sanity Returns to Some Sectors
There is deepening concern over rental inflation, the single biggest component of the CPI index, which is now up to 3.1%—and still slightly below its average for the last decade. It’s likely to rise further as higher house prices pull up rents in their wake.The most extreme transitory effects of the pandemic are otherwise beginning to ease. Car rental prices, for example, are now “only” 39% higher than they were 12 months ago, having topped 100%. Meanwhile, several sectors that suffered a deflationary blow from the pandemic are still not seeing prices recover. Inflation in drug prices is still negative, and prices are no higher than they were four years ago.. And earlier this year — heaven be praised — college-tuition inflation dropped to its lowest since records began in 1979, at 0.2% — although it has since ticked back up to 1.8%. While the rise in prices has broadened, there are still some pockets of the economy where the pandemic appears to have reduced inflation to defensible levels.
Why these indicators? ℹ
Collecting inflation numbers is a massive statistical endeavor. Many claim that the basket of goods in the CPI is biased in some way, but this is a tad unfair, as the Bureau of Labor Statistics provides a breakdown of inflation for all the categories it follows. Housing prices are immensely important and can have knock-on effects on wage demands and other prices. College tuition has long inflated far faster than the rest of the economy, so we look at it in isolation. Two sectors (car rentals and recreation) were hard-hit by the pandemic and can be expected to enjoy sharp but transitory rebounds. Medicinal drugs are a hot-button issue where rising prices would hurt the neediest.
Central Banks Calm the Market Hawks
After much excitement in recent weeks, the picture portrayed by the bond markets is surprisingly very positive—from the point of view of those who don’t want to see inflation return. They see inflation staying high over the next five years (although the five-year breakeven has now dipped back below 3% having set a record high since five-year inflation-linked bonds were introduced in 2002), but then moderating significantly. The five-year/five-year breakeven, covering average inflation between 2026 and 2031, has declined slightly in recent weeks and is now slightly below its average for the last decade. Meanwhile, the yield curve has flattened dramatically, suggesting a belief that central banks will hike rates too much in the short run, and that inflation will be tamed thereafter. The yield curve is also now flatter than it has been on average for the last 10 years.
While markets plainly believe inflation will be well above the Fed’s target for the next few years, therefore, they are still positioned for the central bank to regain control. They do not anticipate accelerating inflation from here. The one intriguing development is that investors are bidding up the possibility of higher inflation in Germany, an economy that has been in deflationary conditions for a decade.
Why these indicators? ℹ
Every day the market is revising its working estimates of inflation, and the bond market gives us precise estimates through the gap between yields on fixed and inflation-linked bonds. Central banks watch breakevens very closely, as they are driven by experts with real money at stake. In the U.S., we follow projections for average inflation over the next five years and (through the five-year/five-year breakeven) the five years after that. The wider the gap between two-year and 10-year bond yields (known as the yield curve), the higher inflation is expected to be. Finally, deflationary psychology has ravaged Germany for years and Japan for decades; we look at expectations for them over the next 10 years.
Businesses Are Still Alarmed
These numbers offer the greatest support for the case that inflation is a near and present danger. All are way above their ranges for the last decade. The small-business survey shows inflation expectations at their highest in four decades, while the Institute for Supply Management numbers for both services and manufacturing hit post-crisis highs earlier this year, and are still at levels barely seen since the early 1970s. These problems are driven by supply bottlenecks, and it isn’t clear that the peak is in. Consumer expectations have also risen very sharply, to their highest since the commodity price spike before the financial crisis, with the latest surveys of one-year expectations from the Conference Board and the University of Michigan both showing a new high for the cycle, while broader consumer confidence declines severely. This could be transitory, and expectations for inflation five years hence are much lower. But expectations so high do raise the risk that inflationary psychology becomes embedded.
Why these indicators? ℹ
If consumers expect higher prices in the surveys conducted by the University of Michigan and the Conference Board, this will be reflected in higher demand now and in higher wage demands, both of which will tend to press inflation upwards. The National Federation of Independent Business survey of the proportion of small-business executives bracing for higher prices and the Institute for Supply Management supply managers’ survey of the prices that larger businesses say they are paying have both proved to be great leading indicators in the past. In all cases, these numbers can prove to be self-fulfilling prophecies, which is why they are monitored so closely.
Commodity Prices Are Rising Again
Rising commodity prices represent exactly the kind of inflation that can attack living standards. But, given the economic collapse a year ago and the rush by speculators to get a leveraged play on the rebound, they don’t give firm evidence of inflation that is more than transitory. At one point, the Bloomberg Industrial Metals index had more than doubled since its Covid-19 bottom in March last year — but it has given up 12% since its peak in October. Energy prices also more than doubled from their Covid shutdown low, but always remained below their average for the last decade and have shed 23% since their October peak. An unwelcome development in the last few weeks is another surge in lumber prices, although they still remain far below their levels from earlier this year. Perhaps the most ominous sign comes from the Commodities Research Board raw industrials index, which covers basic commodities that aren’t in the futures market. In theory, these prices should be driven by supply-and-demand dynamics, and so the 57% rise since last year’s low, to set a new all-time high at which it now appears to have stabilized, should be taken as a “tell” that genuine cost pressures are building for industry.
Why these indicators? ℹ
Inflation shows up first in the price of raw materials, and futures markets capture those changes by the second. Bloomberg futures indexes for industrial metals, agricultural commodities and energy thus provide a good real-time indicator of inflationary pressures. Earlier this year, lumber futures were gripped by a huge price spike; this has now reversed as sawmills increased production but needed to be monitored as lumber was central to early arguments that inflation was returning. The Commodities Research Board’s RIND index covers raw materials such as burlap, tallow and lard that are not tied to futures. If the futures indexes are being driven by speculation rather than genuine inflationary pressure, you would expect to see this index lagging them; the reverse is the case at present.
Low-Skilled Wages Are Picking Up
Wage rises are picking up noticeably—but it’s not yet clear that wage expectations have become untethered from the generally muted conditions of the last decade. The latest figure for average hourly earnings growth, at 4.8%, is above its average for the past 10 years, but represents a slackening of the pace since October. However, there may be compositional effects involved, as the lowest-paid workers tend to be the first let go at the sign of returning problems with the pandemic. Job vacancies are at an all-time record, while small businesses complain that they have never found it harder to recruit workers. This suggests a problem with skill mismatches coming out of the recession. The wage tracker kept by the Atlanta Fed shows wage inflation for low-skilled workers at 3.7%, its highest level since the global financial crisis, and for the fifth month in a row higher than wage inflation for the higher-skilled. This is the first time that wage rises for the low-skilled have outpaced wages for the higher-skilled for so long, suggesting that major changes are afoot in the labor market as it tries to return to normal after the pandemic. Wage rises for the high-skilled are barely above the norm. The National Federation of Independent Business found in September that the highest proportion of its members were raising pay since it started asking the question in 1984.
Why these indicators? ℹ
Higher wages raise costs for companies, which they want to pass on to customers. They also put more money in the pockets of consumers. Although often leaving much to be desired, wage inflation is thus a direct driver of price inflation. Average hourly earnings can be affected by composition — they rose early during the pandemic, for instance, because layoffs disproportionately hit the low-paid — so we include both weekly and hourly figures. The Atlanta Fed produces a handy “nowcast” survey of wage trends for both high- and low-skilled workers, while the National Federation of Independent Business survey tracks how many small businesses are raising rather than cutting pay. This figure hit a record high just before the pandemic and has nearly returned to the same level.
Economists More Worried About Deflation
Broadly, the consensus is that the Fed, like other central banks, will get what it wants. Among economists judged collectively, this belief has been unwavering for months. The Fed is forecasting core PCE of 3% for this year but expects it to decline to 2% in 2023; in other words, it will be transitory. The experts are less anxious for now and think it will reach 2.5% this year and decline in the two following years — more or less perfect for the Fed, which is prepared to let inflation “run hot.” German inflation, after a bobble this year, is expected to fall back to 1.7% in 2023; there’s no sign of a new reflationary cycle there or in Japan, or even China. Whatever markets say, the experts are still more worried about deflation. These measures don’t change much — if the experts ever do get a little nervous, take note.
Why these indicators? ℹ
The forecasts by economic experts greatly impact government planning and policy, and also affect decisions by companies. Bloomberg’s survey offers as good an estimate as we’re going to get of “received expert wisdom” and also shows the spread of opinion into the future.